United Airlines 2014 Annual Report Download - page 151
Download and view the complete annual report
Please find page 151 of the 2014 United Airlines annual report below. You can navigate through the pages in the report by either clicking on the pages listed below, or by using the keyword search tool below to find specific information within the annual report.-
 1
1 -
2
-
3
-
4
-
5
-
6
-
7
-
8
-
9
-
10
-
11
-
12
-
13
-
14
-
15
-
16
-
17
-
18
-
19
-
20
-
21
-
22
-
23
-
24
-
25
-
26
-
27
-
28
-
29
-
30
-
31
-
32
-
33
-
34
-
35
-
36
-
37
-
38
-
39
-
40
-
41
-
42
-
43
-
44
-
45
-
46
-
47
-
48
-
49
-
50
-
51
-
52
-
53
-
54
-
55
-
56
-
57
-
58
-
59
-
60
-
61
-
62
-
63
-
64
-
65
-
66
-
67
-
68
-
69
-
70
-
71
-
72
-
73
-
74
-
75
-
76
-
77
-
78
-
79
-
80
-
81
-
82
-
83
-
84
-
85
-
86
-
87
-
88
-
89
-
90
-
91
-
92
-
93
-
94
-
95
-
96
-
97
-
98
-
99
-
100
-
101
-
102
-
103
-
104
-
105
-
106
-
107
-
108
-
109
-
110
-
111
-
112
-
113
-
114
-
115
-
116
-
117
-
118
-
119
-
120
-
121
-
122
-
123
-
124
-
125
-
126
-
127
-
128
-
129
-
130
-
131
-
132
-
133
-
134
-
135
-
136
-
137
-
138
-
139
-
140
-
 141
141 -
 142
142 -
 143
143 -
 144
144 -
 145
145 -
 146
146 -
 147
147 -
 148
148 -
 149
149 -
 150
150 -
 151
151 -
 152
152 -
 153
153 -
 154
154 -
 155
155 -
 156
156 -
 157
157 -
 158
158 -
 159
159 -
 160
160 -
 161
161
 |
 |

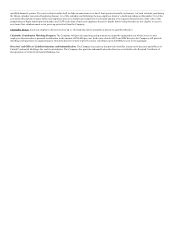
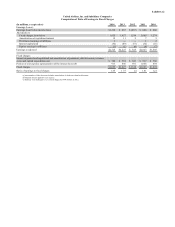
Exhibit 12.2
United Airlines, Inc. and Subsidiary Companies
Computation of Ratio of Earnings to Fixed Charges
(In millions, except ratios) 2014 2013 2012 2011 2010
Earnings (losses):
Earnings (loss) before income taxes $1,110 $ 637 $ (657) $ 848 $ 286
Add (deduct):
Fixed charges, from below 1,655 1,627 1,514 2,005 1,274
Amortization of capitalized interest 12 11 9 7 5
Distributed earnings of affiliates 1 — — 1 2
Interest capitalized (52) (49) (37) (32) (15)
Equity earnings in affiliates (1) (1) (4) (6) (7)
Earnings as adjusted $2,725 $2,225 $ 825 $2,823 $1,545
Fixed charges:
Interest expensed and capitalized and amortization of premiums, debt discounts, issuance
costs, and capital expenditures (a) $ 742 $ 781 $ 823 $ 937 $ 780
Portion of rent expense representative of the interest factor (b) 913 846 691 1,068 494
Fixed charges $1,655 $1,627 $1,514 $2,005 $1,274
Ratio of earnings to fixed charges 1.65 1.37 (c) 1.41 1.21
(a) Amortization of debt discounts includes amortization of fresh-start valuation discounts.
(b) Imputed interest applied to rent expense.
(c) Earnings were inadequate to cover fixed charges by $689 million in 2012.