US Airways 2010 Annual Report Download - page 92
Download and view the complete annual report
Please find page 92 of the 2010 US Airways annual report below. You can navigate through the pages in the report by either clicking on the pages listed below, or by using the keyword search tool below to find specific information within the annual report.-
 1
1 -
2
-
3
-
4
-
5
-
6
-
7
-
8
-
9
-
10
-
11
-
12
-
13
-
14
-
15
-
16
-
17
-
18
-
19
-
20
-
21
-
22
-
23
-
24
-
25
-
26
-
27
-
28
-
29
-
30
-
31
-
32
-
33
-
34
-
35
-
36
-
37
-
38
-
39
-
40
-
41
-
42
-
43
-
44
-
45
-
46
-
47
-
48
-
49
-
50
-
51
-
52
-
53
-
54
-
55
-
56
-
57
-
58
-
59
-
60
-
61
-
62
-
63
-
64
-
65
-
66
-
67
-
68
-
69
-
70
-
71
-
72
-
73
-
74
-
75
-
76
-
77
-
78
-
79
-
80
-
81
-
 82
82 -
 83
83 -
 84
84 -
 85
85 -
 86
86 -
 87
87 -
 88
88 -
 89
89 -
 90
90 -
 91
91 -
 92
92 -
 93
93 -
 94
94 -
 95
95 -
 96
96 -
 97
97 -
 98
98 -
 99
99 -
 100
100 -
 101
101 -
 102
102 -
103
-
104
-
105
-
106
-
107
-
108
-
109
-
110
-
111
-
112
-
113
-
114
-
115
-
116
-
117
-
118
-
119
-
120
-
121
-
122
-
123
-
124
-
125
-
126
-
127
-
128
-
129
-
130
-
131
-
132
-
133
-
134
-
135
-
136
-
137
-
138
-
139
-
140
-
141
-
142
-
143
-
144
-
145
-
146
-
147
-
148
-
149
-
150
-
151
-
152
-
153
-
154
-
155
-
156
-
157
-
158
-
159
-
160
-
161
-
162
-
163
-
164
-
165
-
166
-
167
-
168
-
169
 |
 |

Table of Contents
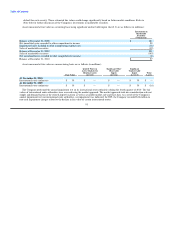
(a) Fuel Price Risk
The Company periodically enters into derivative contracts comprised of heating oil-based derivative instruments to hedge a portion of
its projected jet fuel requirements. Since the third quarter of 2008, the Company has not entered into any new transactions to hedge its
fuel consumption, and the Company has not had any fuel hedging contracts outstanding since the third quarter of 2009.
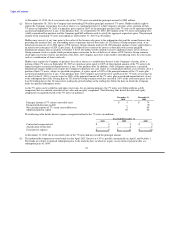
The Company's fuel hedging instruments did not qualify for hedge accounting. Accordingly, the derivative hedging instruments were
recorded as an asset or liability on the balance sheet at fair value and any changes in fair value were recorded in the period of change as
gains or losses on fuel hedging instruments, net in operating expenses in the accompanying consolidated statements of operations. The
following table details the Company's loss (gain) on fuel hedging instruments, net (in millions):
Year Ended Year Ended Year Ended
December 31, December 31, December 31,
2010 2009 2008
Realized loss (gain) $ — $ 382 $ (140)
Unrealized loss (gain) — (375) 496
Loss on fuel hedging instruments, net $ — $ 7 $ 356
The unrealized gains in 2009 were related to the reversal of prior period unrealized losses due to contracts settling in 2009.
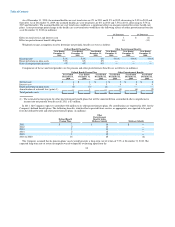
(b) Credit Risk
Cash, Cash Equivalents and Investments in Marketable Securities
The Company invests available cash in money market securities, certificates of deposit and highly liquid debt instruments.
As of December 31, 2010, the Company held auction rate securities with a fair value of $57 million ($84 million par value), which are
classified as available-for-sale securities and noncurrent assets on the Company's consolidated balance sheets. Contractual maturities for
these auction rate securities range from 23 to 42 years, with 78% of the Company's portfolio maturing within the next 30 years (2033 –
2036) and 22% maturing thereafter (2052). As a result of the liquidity issues experienced in the global credit and capital markets, all of
the Company's auction rate securities have experienced failed auctions since August 2007. Refer to Note 7 for discussion on how the
Company determines the fair value of its investments in auction rate securities.
During 2010, the Company sold certain investments in auction rate securities for proceeds of $145 million, resulting in $53 million of
net realized gains recorded in nonoperating expense, net, of which $52 million represents the reclassification of prior period net
unrealized gains from other comprehensive income as determined on a specific-identification basis. Proceeds for all of these sale
transactions approximated the carrying value of the Company's investments. Additionally, the Company recorded net unrealized losses of
$1 million in other comprehensive income related to the decline in fair value of certain investments in auction rate securities, which offset
previously recognized unrealized gains.
During 2009, the Company sold certain investments in auction rate securities for proceeds of $32 million. Additionally, the Company
recorded net unrealized gains of $58 million in other comprehensive income related to the increase in fair value of certain investments in
auction rate securities, as well as $10 million in other-than-temporary impairment charges recorded in other nonoperating expense, net
related to the decline in fair value of certain investments in auction rate securities.
In 2008, the Company recorded $214 million of other-than-temporary impairment charges in other nonoperating expense, net. These
charges included $48 million of previously recorded unrealized losses in other comprehensive income. The Company's conclusion for the
$214 million other-than-temporary impairment was due to the length of time and extent to which the fair value was less than cost for
certain securities.
91