US Airways 2010 Annual Report Download - page 125
Download and view the complete annual report
Please find page 125 of the 2010 US Airways annual report below. You can navigate through the pages in the report by either clicking on the pages listed below, or by using the keyword search tool below to find specific information within the annual report.-
 1
1 -
2
-
3
-
4
-
5
-
6
-
7
-
8
-
9
-
10
-
11
-
12
-
13
-
14
-
15
-
16
-
17
-
18
-
19
-
20
-
21
-
22
-
23
-
24
-
25
-
26
-
27
-
28
-
29
-
30
-
31
-
32
-
33
-
34
-
35
-
36
-
37
-
38
-
39
-
40
-
41
-
42
-
43
-
44
-
45
-
46
-
47
-
48
-
49
-
50
-
51
-
52
-
53
-
54
-
55
-
56
-
57
-
58
-
59
-
60
-
61
-
62
-
63
-
64
-
65
-
66
-
67
-
68
-
69
-
70
-
71
-
72
-
73
-
74
-
75
-
76
-
77
-
78
-
79
-
80
-
81
-
82
-
83
-
84
-
85
-
86
-
87
-
88
-
89
-
90
-
91
-
92
-
93
-
94
-
95
-
96
-
97
-
98
-
99
-
100
-
101
-
102
-
103
-
104
-
105
-
106
-
107
-
108
-
109
-
110
-
111
-
112
-
113
-
114
-
 115
115 -
 116
116 -
 117
117 -
 118
118 -
 119
119 -
 120
120 -
 121
121 -
 122
122 -
 123
123 -
 124
124 -
 125
125 -
 126
126 -
 127
127 -
 128
128 -
 129
129 -
 130
130 -
 131
131 -
 132
132 -
 133
133 -
 134
134 -
 135
135 -
136
-
137
-
138
-
139
-
140
-
141
-
142
-
143
-
144
-
145
-
146
-
147
-
148
-
149
-
150
-
151
-
152
-
153
-
154
-
155
-
156
-
157
-
158
-
159
-
160
-
161
-
162
-
163
-
164
-
165
-
166
-
167
-
168
-
169
 |
 |

Table of Contents
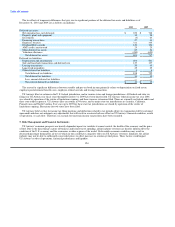
The tax effects of temporary differences that give rise to significant portions of the deferred tax assets and liabilities as of
December 31, 2010 and 2009 are as follows (in millions):
2010 2009
Deferred tax assets:
Net operating loss carryforwards $ 670 $ 748
Property, plant and equipment 35 28
Investments (3) 63
Financing transactions 27 41
Employee benefits 311 335
Dividend Miles awards 120 126
AMT credit carryforward 25 25
Other deferred tax assets 69 24
Valuation allowance (450) (653)
Net deferred tax assets 804 737
Deferred tax liabilities:
Depreciation and amortization 603 541
Sale and leaseback transactions and deferred rent 127 137
Leasing transactions 59 45
Long-lived intangibles 25 25
Other deferred tax liabilities 4 4
Total deferred tax liabilities 818 752
Net deferred tax liabilities 14 15
Less: current deferred tax liabilities — —
Non-current deferred tax liabilities $ 14 $ 15
The reason for significant differences between taxable and pre-tax book income primarily relates to depreciation on fixed assets,
employee postretirement benefit costs, employee-related accruals and leasing transactions.
US Airways files tax returns in the U.S. federal jurisdiction, and in various states and foreign jurisdictions. All federal and state tax
filings for US Airways for fiscal years through December 31, 2009 have been timely filed. US Airways' federal income tax year 2006
was closed by operation of the statute of limitations expiring, and there were no extensions filed. There are currently no federal audits and
three state audits in process. US Airways files tax returns in 44 states, and its major state tax jurisdictions are Arizona, California,
Pennsylvania and North Carolina. Tax years up to 2005 for these state tax jurisdictions are closed by operation of the statute of
limitations expiring. Extensions for two states have been filed.
US Airways believes that its income tax filing positions and deductions related to tax periods subject to examination will be sustained
upon audit and does not anticipate any adjustments that will result in a material adverse effect on US Airways' financial condition, results
of operations, or cash flow. Therefore, no accruals for uncertain income tax positions have been recorded.
5. Risk Management and Financial Instruments
US Airways' economic prospects are heavily dependent upon two variables it cannot control: the health of the economy and the price
of fuel. Due to the discretionary nature of business and leisure travel spending, airline industry revenues are heavily influenced by the
condition of the U.S. economy and the economies in other regions of the world. Unfavorable economic conditions may result in
decreased passenger demand for air travel, which in turn could have a negative effect on US Airways' revenues. Similarly, the airline
industry may not be able to sufficiently raise ticket prices to offset increases in aviation jet fuel prices. These factors could impact
US Airways' results of operations, financial performance and liquidity.
124