US Airways 2010 Annual Report Download - page 57
Download and view the complete annual report
Please find page 57 of the 2010 US Airways annual report below. You can navigate through the pages in the report by either clicking on the pages listed below, or by using the keyword search tool below to find specific information within the annual report.-
 1
1 -
2
-
3
-
4
-
5
-
6
-
7
-
8
-
9
-
10
-
11
-
12
-
13
-
14
-
15
-
16
-
17
-
18
-
19
-
20
-
21
-
22
-
23
-
24
-
25
-
26
-
27
-
28
-
29
-
30
-
31
-
32
-
33
-
34
-
35
-
36
-
37
-
38
-
39
-
40
-
41
-
42
-
43
-
44
-
45
-
46
-
 47
47 -
 48
48 -
 49
49 -
 50
50 -
 51
51 -
 52
52 -
 53
53 -
 54
54 -
 55
55 -
 56
56 -
 57
57 -
 58
58 -
 59
59 -
 60
60 -
 61
61 -
 62
62 -
 63
63 -
 64
64 -
 65
65 -
 66
66 -
 67
67 -
68
-
69
-
70
-
71
-
72
-
73
-
74
-
75
-
76
-
77
-
78
-
79
-
80
-
81
-
82
-
83
-
84
-
85
-
86
-
87
-
88
-
89
-
90
-
91
-
92
-
93
-
94
-
95
-
96
-
97
-
98
-
99
-
100
-
101
-
102
-
103
-
104
-
105
-
106
-
107
-
108
-
109
-
110
-
111
-
112
-
113
-
114
-
115
-
116
-
117
-
118
-
119
-
120
-
121
-
122
-
123
-
124
-
125
-
126
-
127
-
128
-
129
-
130
-
131
-
132
-
133
-
134
-
135
-
136
-
137
-
138
-
139
-
140
-
141
-
142
-
143
-
144
-
145
-
146
-
147
-
148
-
149
-
150
-
151
-
152
-
153
-
154
-
155
-
156
-
157
-
158
-
159
-
160
-
161
-
162
-
163
-
164
-
165
-
166
-
167
-
168
-
169
 |
 |

Table of Contents
Liquidity and Capital Resources
As of December 31, 2010, our cash, cash equivalents, investments in marketable securities and restricted cash were $2.28 billion, of
which $364 million was restricted. Our investments in marketable securities included $57 million of auction rate securities at fair value
($84 million par value) that are classified as noncurrent assets on our consolidated balance sheets.
Investments in Marketable Securities
As of December 31, 2010, we held auction rate securities with a fair value of $57 million ($84 million par value), which are classified
as available-for-sale securities and noncurrent assets on our consolidated balance sheets. Contractual maturities for these auction rate
securities range from 23 to 42 years, with 78% of our portfolio maturing within the next 30 years (2033 – 2036) and 22% maturing
thereafter (2052). As a result of the liquidity issues experienced in the global credit and capital markets, all of our auction rate securities
have experienced failed auctions since August 2007.
During 2010, we sold certain investments in auction rate securities for proceeds of $145 million, resulting in $53 million of net
realized gains recorded in nonoperating expense, net, of which $52 million represents the reclassification of prior period net unrealized
gains from other comprehensive income as determined on a specific-identification basis. Proceeds for all of these sale transactions
approximated the carrying value of our investments. We have now sold more than 75% of our investments in auction rate securities,
which have experienced failed auctions since August 2007.
We continue to monitor the market for auction rate securities and consider its impact (if any) on the fair value of our remaining
investments in these securities. If the current market conditions deteriorate, we may be required to record additional impairment charges
in other nonoperating expense, net in future periods.
We believe that, based on our current unrestricted cash and cash equivalents balance at December 31, 2010, the current lack of
liquidity in our remaining investments in auction rate securities will not have a material impact on our liquidity, our cash flow or our
ability to fund our operations.
Sources and Uses of Cash
US Airways Group
2010 Compared to 2009
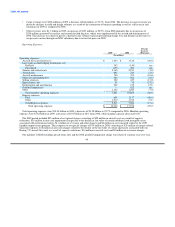
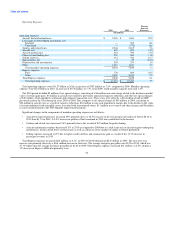
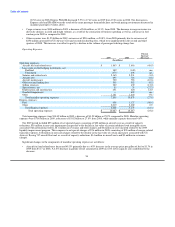
Net cash provided by operating activities was $804 million and $59 million in 2010 and 2009, respectively, a year-over-year
improvement of $745 million. Growth in operating cash flows resulted from a $1.45 billion increase in total operating revenues driven
primarily by higher yields as a result of the improved economy and industry capacity discipline. The increase in revenues was offset in
part by increases in mainline and Express fuel expense, which was $700 million, or 28.3% higher than the 2009 period on a 0.9%
increase in total system capacity.
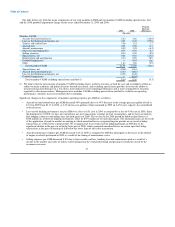
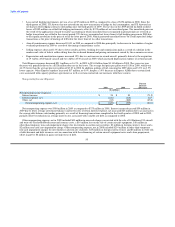
Net cash provided by investing activities was $63 million in 2010 as compared to net cash used in investing activities of $495 million
in 2009. Principal investing activities in 2010 included proceeds from sales of marketable securities of $325 million, including sales of
auction rate securities of $145 million, and a $116 million decrease in restricted cash. These cash inflows were offset in part by purchases
of marketable securities of $180 million and expenditures for property and equipment totaling $201 million. Expenditures for property
and equipment related primarily to the purchase of Airbus aircraft and payments of equipment purchase deposits for certain aircraft on
order. Restricted cash decreased primarily due to a change in the amount of holdback held by certain credit card processors for advance
ticket sales for which US Airways has not yet provided air transportation. Principal investing activities in 2009 included expenditures for
property and equipment totaling $683 million primarily related to the purchase of Airbus aircraft. These cash outflows were offset in part
by $76 million in proceeds from dispositions of property and equipment, a $60 million decrease in restricted cash and proceeds from sales
of investments in marketable securities of $52 million. The $76 million in proceeds from dispositions of property and equipment was the
result of the swap of one of US Airways' owned aircraft in exchange for the leased aircraft involved in the Flight 1549 accident and sale-
leaseback transactions involving four aircraft and five engines. Restricted cash decreased
56