US Airways 2010 Annual Report Download - page 49
Download and view the complete annual report
Please find page 49 of the 2010 US Airways annual report below. You can navigate through the pages in the report by either clicking on the pages listed below, or by using the keyword search tool below to find specific information within the annual report.-
 1
1 -
2
-
3
-
4
-
5
-
6
-
7
-
8
-
9
-
10
-
11
-
12
-
13
-
14
-
15
-
16
-
17
-
18
-
19
-
20
-
21
-
22
-
23
-
24
-
25
-
26
-
27
-
28
-
29
-
30
-
31
-
32
-
33
-
34
-
35
-
36
-
37
-
38
-
 39
39 -
 40
40 -
 41
41 -
 42
42 -
 43
43 -
 44
44 -
 45
45 -
 46
46 -
 47
47 -
 48
48 -
 49
49 -
 50
50 -
 51
51 -
 52
52 -
 53
53 -
 54
54 -
 55
55 -
 56
56 -
 57
57 -
 58
58 -
 59
59 -
60
-
61
-
62
-
63
-
64
-
65
-
66
-
67
-
68
-
69
-
70
-
71
-
72
-
73
-
74
-
75
-
76
-
77
-
78
-
79
-
80
-
81
-
82
-
83
-
84
-
85
-
86
-
87
-
88
-
89
-
90
-
91
-
92
-
93
-
94
-
95
-
96
-
97
-
98
-
99
-
100
-
101
-
102
-
103
-
104
-
105
-
106
-
107
-
108
-
109
-
110
-
111
-
112
-
113
-
114
-
115
-
116
-
117
-
118
-
119
-
120
-
121
-
122
-
123
-
124
-
125
-
126
-
127
-
128
-
129
-
130
-
131
-
132
-
133
-
134
-
135
-
136
-
137
-
138
-
139
-
140
-
141
-
142
-
143
-
144
-
145
-
146
-
147
-
148
-
149
-
150
-
151
-
152
-
153
-
154
-
155
-
156
-
157
-
158
-
159
-
160
-
161
-
162
-
163
-
164
-
165
-
166
-
167
-
168
-
169
 |
 |

Table of Contents
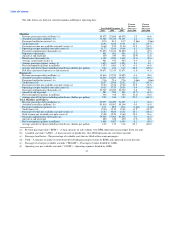
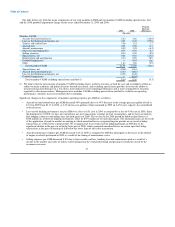
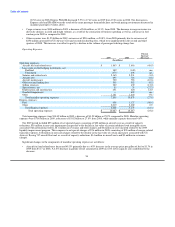
• Depreciation and amortization expense per ASM increased 18% due to a net increase in owned aircraft, primarily driven by the
acquisition of 19 Airbus A320 family aircraft and two Airbus A330 aircraft in 2009, which increased depreciation expense on
owned aircraft.
Total Express expenses decreased $530 million, or 17.4%, in 2009 to $2.52 billion from $3.05 billion in 2008. The year-over-year
decrease was primarily driven by a $528 million decrease in fuel costs. The average fuel price per gallon was $1.80 in 2009, which was
44.3% lower than the average price per gallon of $3.23 in 2008. In addition, gallons of fuel consumed in 2009 decreased 3.8% on 3.9%
lower capacity. Other Express expenses decreased $2 million, or 0.1%, despite a 3.9% decrease in Express ASMs due to certain fixed
costs associated with our capacity purchase agreements as well as certain contractual rate increases with these carriers.
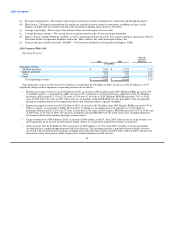
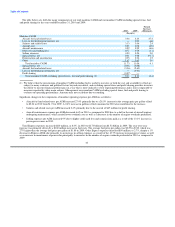
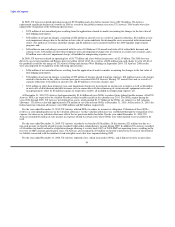
Nonoperating Income (Expense):
Percent
Increase
2009 2008 (Decrease)
(In millions)
Nonoperating income (expense):
Interest income $ 24 $ 83 (71.5)
Interest expense, net (304) (258) 17.9
Other, net (81) (240) (66.5)
Total nonoperating expense, net $ (361) $ (415) (13.1)
Net nonoperating expense was $361 million in 2009 as compared to $415 million in 2008. Interest income decreased $59 million in
2009 due to lower average investment balances and lower rates of return. Interest expense, net increased $46 million due to an increase in
the average debt balance outstanding primarily as a result of financing transactions completed in the fourth quarter of 2008 and in 2009,
partially offset by reductions in average interest rates associated with variable rate debt as compared to 2008.
Other nonoperating expense, net in 2009 included $49 million in non-cash charges associated with the sale of 10 Embraer 190 aircraft
and write off of related debt discount and issuance costs, a $14 million loss on the sale of certain aircraft equipment, $10 million in
other-than-temporary non-cash impairment charges for investments in auction rate securities, $3 million in foreign currency losses and a
$2 million non-cash asset impairment charge. Other nonoperating expense, net in 2008 included $214 million in other-than-temporary
non-cash impairment charges for investments in auction rate securities, $25 million in foreign currency losses and $7 million in write offs
of debt discount and debt issuance costs in connection with the refinancing of certain aircraft equipment notes and certain loan
prepayments, offset in part by $8 million in gains on forgiveness of debt.
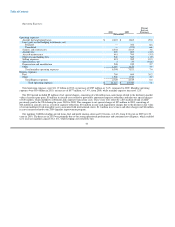
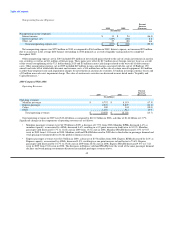
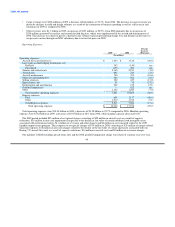
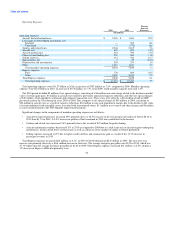
US Airways' Results of Operations
In 2010, US Airways realized operating income of $781 million and income before income taxes of $600 million. US Airways
experienced year-over-year growth in revenues driven by higher yields as a result of the improved economy and industry capacity
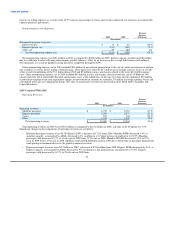
discipline. US Airways' 2010 results were also impacted by recognition of the following special items:
• $5 million of net special charges, consisting of a $6 million non-cash charge related to the decline in market value of certain spare
parts, $5 million in aircraft costs related to previously announced capacity reductions and other net special charges of $10 million,
which included a settlement and corporate transaction costs. These costs were offset by a $16 million refund of ASIF previously
paid to the TSA during the years 2005 to 2009; and
• $53 million of net realized gains related to the sale of certain investments in auction rate securities as well as an $11 million
settlement gain, offset by $5 million in non-cash charges related to the write off of debt issuance costs, all included in
nonoperating expense, net.
48