US Airways 2010 Annual Report Download - page 33
Download and view the complete annual report
Please find page 33 of the 2010 US Airways annual report below. You can navigate through the pages in the report by either clicking on the pages listed below, or by using the keyword search tool below to find specific information within the annual report.-
 1
1 -
2
-
3
-
4
-
5
-
6
-
7
-
8
-
9
-
10
-
11
-
12
-
13
-
14
-
15
-
16
-
17
-
18
-
19
-
20
-
21
-
22
-
 23
23 -
 24
24 -
 25
25 -
 26
26 -
 27
27 -
 28
28 -
 29
29 -
 30
30 -
 31
31 -
 32
32 -
 33
33 -
 34
34 -
 35
35 -
 36
36 -
 37
37 -
 38
38 -
 39
39 -
 40
40 -
 41
41 -
 42
42 -
 43
43 -
44
-
45
-
46
-
47
-
48
-
49
-
50
-
51
-
52
-
53
-
54
-
55
-
56
-
57
-
58
-
59
-
60
-
61
-
62
-
63
-
64
-
65
-
66
-
67
-
68
-
69
-
70
-
71
-
72
-
73
-
74
-
75
-
76
-
77
-
78
-
79
-
80
-
81
-
82
-
83
-
84
-
85
-
86
-
87
-
88
-
89
-
90
-
91
-
92
-
93
-
94
-
95
-
96
-
97
-
98
-
99
-
100
-
101
-
102
-
103
-
104
-
105
-
106
-
107
-
108
-
109
-
110
-
111
-
112
-
113
-
114
-
115
-
116
-
117
-
118
-
119
-
120
-
121
-
122
-
123
-
124
-
125
-
126
-
127
-
128
-
129
-
130
-
131
-
132
-
133
-
134
-
135
-
136
-
137
-
138
-
139
-
140
-
141
-
142
-
143
-
144
-
145
-
146
-
147
-
148
-
149
-
150
-
151
-
152
-
153
-
154
-
155
-
156
-
157
-
158
-
159
-
160
-
161
-
162
-
163
-
164
-
165
-
166
-
167
-
168
-
169
 |
 |
Table of Contents
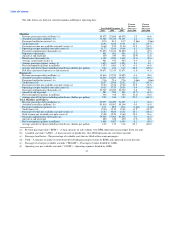
Item 6. Selected Financial Data
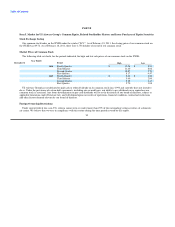
Selected Consolidated Financial Data of US Airways Group
The selected consolidated financial data presented below under the captions "Consolidated statements of operations data" and
"Consolidated balance sheet data" for the years ended December 31, 2010, 2009 and 2008 and as of December 31, 2010 and 2009 are
derived from US Airways Group's audited consolidated financial statements included elsewhere in this report. The selected consolidated
financial data for the years ended December 31, 2007 and 2006 and as of December 31, 2008, 2007 and 2006 are derived from US
Airways Group's audited consolidated financial statements not included in this report. The selected consolidated financial data should be
read in conjunction with US Airways Group's consolidated financial statements for the respective periods, the related notes and the
related reports of KPMG LLP, an independent registered public accounting firm.
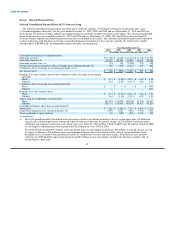
Year Ended December 31,
2010 2009 2008 2007 2006
(In millions, except share and per share data)
Consolidated statements of operations data:
Operating revenues $ 11,908 $ 10,458 $ 12,118 $ 11,700 $ 11,557
Operating expenses (a) 11,127 10,340 13,918 11,167 10,999
Operating income (loss) (a) 781 118 (1,800) 533 558
Income (loss) before cumulative effect of change in accounting principle (b) 502 (205) (2,215) 423 285
Cumulative effect of change in accounting principle, net (c) — — — — 1
Net income (loss) $ 502 $ (205) $ (2,215) $ 423 $ 286
Earnings (loss) per common share before cumulative effect of change in accounting
principle:
Basic $ 3.11 $ (1.54) $ (22.11) $ 4.62 $ 3.30
Diluted 2.61 (1.54) (22.11) 4.52 3.20
Cumulative effect of change in accounting principle:
Basic $ — $ — $ — $ — $ 0.01
Diluted — — — — 0.01
Earnings (loss) per common share:
Basic $ 3.11 $ (1.54) $ (22.11) $ 4.62 $ 3.31
Diluted 2.61 (1.54) (22.11) 4.52 3.21
Shares used for computation (in thousands):
Basic 161,412 133,000 100,168 91,536 86,447
Diluted 201,131 133,000 100,168 95,603 93,821
Consolidated balance sheet data (at end of period):
Total assets $ 7,819 $ 7,454 $ 7,214 $ 8,040 $ 7,576
Long-term obligations, less current maturities (d) 4,559 4,643 4,281 3,654 3,454
Total stockholders' equity (deficit) 84 (355) (494) 1,455 990
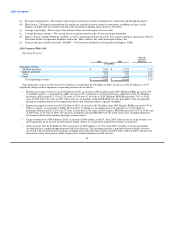
(a) The 2010 period included a $6 million non-cash charge related to the decline in market value of certain spare parts, $5 million in
aircraft costs related to previously announced capacity reductions and other net special charges of $10 million, which included a
settlement and corporate transaction costs. These costs were offset by a $16 million refund of ASIF and a $1 million refund of ASIF
for our Express subsidiaries previously paid to the TSA during the years 2005 to 2009.
The 2009 period included $375 million of net unrealized gains on fuel hedging instruments, $22 million in aircraft costs as a result
of capacity reductions, $16 million in non-cash impairment charges due to the decline in fair value of certain indefinite lived
intangible assets associated with international routes, $11 million in severance and other charges, $6 million in costs incurred
related to the 2009 liquidity improvement program and $3 million in non-cash charges related to the decline in market value of
certain Express spare parts.
32