US Airways 2010 Annual Report Download - page 73
Download and view the complete annual report
Please find page 73 of the 2010 US Airways annual report below. You can navigate through the pages in the report by either clicking on the pages listed below, or by using the keyword search tool below to find specific information within the annual report.-
 1
1 -
2
-
3
-
4
-
5
-
6
-
7
-
8
-
9
-
10
-
11
-
12
-
13
-
14
-
15
-
16
-
17
-
18
-
19
-
20
-
21
-
22
-
23
-
24
-
25
-
26
-
27
-
28
-
29
-
30
-
31
-
32
-
33
-
34
-
35
-
36
-
37
-
38
-
39
-
40
-
41
-
42
-
43
-
44
-
45
-
46
-
47
-
48
-
49
-
50
-
51
-
52
-
53
-
54
-
55
-
56
-
57
-
58
-
59
-
60
-
61
-
62
-
 63
63 -
 64
64 -
 65
65 -
 66
66 -
 67
67 -
 68
68 -
 69
69 -
 70
70 -
 71
71 -
 72
72 -
 73
73 -
 74
74 -
 75
75 -
 76
76 -
 77
77 -
 78
78 -
 79
79 -
 80
80 -
 81
81 -
 82
82 -
 83
83 -
84
-
85
-
86
-
87
-
88
-
89
-
90
-
91
-
92
-
93
-
94
-
95
-
96
-
97
-
98
-
99
-
100
-
101
-
102
-
103
-
104
-
105
-
106
-
107
-
108
-
109
-
110
-
111
-
112
-
113
-
114
-
115
-
116
-
117
-
118
-
119
-
120
-
121
-
122
-
123
-
124
-
125
-
126
-
127
-
128
-
129
-
130
-
131
-
132
-
133
-
134
-
135
-
136
-
137
-
138
-
139
-
140
-
141
-
142
-
143
-
144
-
145
-
146
-
147
-
148
-
149
-
150
-
151
-
152
-
153
-
154
-
155
-
156
-
157
-
158
-
159
-
160
-
161
-
162
-
163
-
164
-
165
-
166
-
167
-
168
-
169
 |
 |

Table of Contents
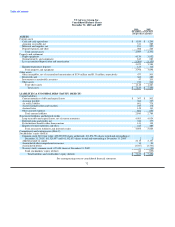
US Airways Group, Inc.
Consolidated Balance Sheets
December 31, 2010 and 2009
2010 2009
(In millions, except share
and per share amounts)
ASSETS
Current assets
Cash and cash equivalents $ 1,859 $ 1,299
Accounts receivable, net 311 285
Materials and supplies, net 231 227
Prepaid expenses and other 508 520
Total current assets 2,909 2,331
Property and equipment
Flight equipment 4,134 3,852
Ground property and equipment 843 883
Less accumulated depreciation and amortization (1,304) (1,151)
3,673 3,584
Equipment purchase deposits 123 112
Total property and equipment 3,796 3,696
Other assets
Other intangibles, net of accumulated amortization of $139 million and $113 million, respectively 477 503
Restricted cash 364 480
Investments in marketable securities 57 203
Other assets 216 241
Total other assets 1,114 1,427
Total assets $ 7,819 $ 7,454
LIABILITIES & STOCKHOLDERS' EQUITY (DEFICIT)
Current liabilities
Current maturities of debt and capital leases $ 397 $ 502
Accounts payable 386 337
Air traffic liability 861 778
Accrued compensation and vacation 245 178
Accrued taxes 149 141
Other accrued expenses 802 853
Total current liabilities 2,840 2,789
Noncurrent liabilities and deferred credits
Long-term debt and capital leases, net of current maturities 4,003 4,024
Deferred gains and credits, net 336 377
Postretirement benefits other than pensions 141 130
Employee benefit liabilities and other 415 489
Total noncurrent liabilities and deferred credits 4,895 5,020
Commitments and contingencies (Note 9)
Stockholders' equity (deficit)
Common stock, $0.01 par value; 400,000,000 shares authorized, 161,874,756 shares issued and outstanding at
December 31, 2010; 161,520,457 and 161,102,833 shares issued and outstanding at December 31, 2009 2 2
Additional paid-in capital 2,115 2,107
Accumulated other comprehensive income 14 90
Accumulated deficit (2,047) (2,541)
Treasury stock, common stock, 417,624 shares at December 31, 2009 — (13)
Total stockholders' equity (deficit) 84 (355)
Total liabilities and stockholders' equity (deficit) $ 7,819 $ 7,454
See accompanying notes to consolidated financial statements.
72