US Airways 2010 Annual Report Download - page 56
Download and view the complete annual report
Please find page 56 of the 2010 US Airways annual report below. You can navigate through the pages in the report by either clicking on the pages listed below, or by using the keyword search tool below to find specific information within the annual report.-
 1
1 -
2
-
3
-
4
-
5
-
6
-
7
-
8
-
9
-
10
-
11
-
12
-
13
-
14
-
15
-
16
-
17
-
18
-
19
-
20
-
21
-
22
-
23
-
24
-
25
-
26
-
27
-
28
-
29
-
30
-
31
-
32
-
33
-
34
-
35
-
36
-
37
-
38
-
39
-
40
-
41
-
42
-
43
-
44
-
45
-
 46
46 -
 47
47 -
 48
48 -
 49
49 -
 50
50 -
 51
51 -
 52
52 -
 53
53 -
 54
54 -
 55
55 -
 56
56 -
 57
57 -
 58
58 -
 59
59 -
 60
60 -
 61
61 -
 62
62 -
 63
63 -
 64
64 -
 65
65 -
 66
66 -
67
-
68
-
69
-
70
-
71
-
72
-
73
-
74
-
75
-
76
-
77
-
78
-
79
-
80
-
81
-
82
-
83
-
84
-
85
-
86
-
87
-
88
-
89
-
90
-
91
-
92
-
93
-
94
-
95
-
96
-
97
-
98
-
99
-
100
-
101
-
102
-
103
-
104
-
105
-
106
-
107
-
108
-
109
-
110
-
111
-
112
-
113
-
114
-
115
-
116
-
117
-
118
-
119
-
120
-
121
-
122
-
123
-
124
-
125
-
126
-
127
-
128
-
129
-
130
-
131
-
132
-
133
-
134
-
135
-
136
-
137
-
138
-
139
-
140
-
141
-
142
-
143
-
144
-
145
-
146
-
147
-
148
-
149
-
150
-
151
-
152
-
153
-
154
-
155
-
156
-
157
-
158
-
159
-
160
-
161
-
162
-
163
-
164
-
165
-
166
-
167
-
168
-
169
 |
 |

Table of Contents
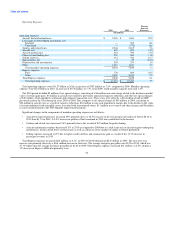
• Loss on fuel hedging instruments, net was a loss of $7 million in 2009 as compared to a loss of $356 million in 2008. Since the
third quarter of 2008, US Airways has not entered into any new transactions to hedge its fuel consumption, and US Airways has
not had any fuel hedging contracts outstanding since the third quarter of 2009. The net loss in the 2009 period included realized
losses of $382 million on settled fuel hedging instruments, offset by $375 million of net unrealized gains. The unrealized gains are
the result of the application of mark-to-market accounting in which unrealized losses recognized in prior periods are reversed as
hedge transactions are settled in the current period. US Airways recognized net losses from its fuel hedging program in 2008 due
to the significant decline in the price of oil in the latter part of 2008, which generated unrealized losses on certain open fuel hedge
transactions as the price of heating oil fell below the lower limit of its collar transactions.
• Aircraft maintenance expense decreased 10.6% in 2009 as compared to 2008 due principally to decreases in the number of engine
overhauls performed in 2009 as a result of the timing of maintenance cycles.
• Selling expenses decreased 13% due to lower credit card fees, booking fees and commissions paid as a result of a decline in the
number and value of tickets sold resulting from the weakened demand and pricing environment caused by the economic recession.
• Depreciation and amortization expense increased 12% due to a net increase in owned aircraft, primarily driven by the acquisition
of 19 Airbus A320 family aircraft and two Airbus A330 aircraft in 2009, which increased depreciation expense on owned aircraft.
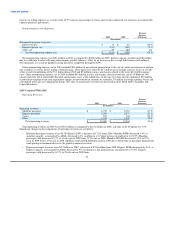
Total Express expenses decreased $511 million, or 16.3%, in 2009 to $2.63 billion from $3.14 billion in 2008. The year-over-year
decrease was primarily driven by a $528 million decrease in fuel costs. The average fuel price per gallon was $1.80 in 2009, which was
44.3% lower than the average price per gallon of $3.23 in 2008. In addition, gallons of fuel consumed in 2009 decreased 3.8% on 3.9%
lower capacity. Other Express expenses increased $17 million, or 0.9%, despite a 3.9% decrease in Express ASMs due to certain fixed
costs associated with capacity purchase agreements as well as certain contractual rate increases with these carriers.
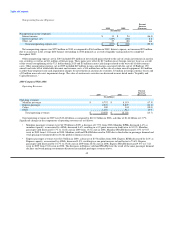
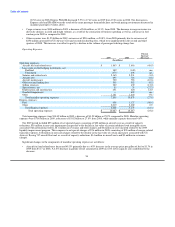
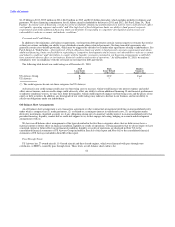
Nonoperating Income (Expense):
Percent
Increase
2009 2008 (Decrease)
(In millions)
Nonoperating income (expense):
Interest income $ 24 $ 83 (71.5)
Interest expense, net (241) (218) 10.7
Other, net (83) (240) (65.8)
Total nonoperating expense, net $ (300) $ (375) (20.1)
Net nonoperating expense was $300 million in 2009 as compared to $375 million in 2008. Interest income decreased $59 million in
2009 due to lower average investment balances and lower rates of return. Interest expense, net increased $23 million due to an increase in
the average debt balance outstanding primarily as a result of financing transactions completed in the fourth quarter of 2008 and in 2009,
partially offset by reductions in average interest rates associated with variable rate debt as compared to 2008.
Other nonoperating expense, net in 2009 included $49 million in non-cash charges associated with the sale of 10 Embraer 190 aircraft
and write off of related debt discount and issuance costs, a $14 million loss on the sale of certain aircraft equipment, $10 million in
other-than-temporary non-cash impairment charges for investments in auction rate securities, $3 million in foreign currency losses and a
$2 million non-cash asset impairment charge. Other nonoperating expense, net in 2008 included $214 million in other-than-temporary
non-cash impairment charges for investments in auction rate securities, $25 million in foreign currency losses and $6 million in write offs
of debt discount and debt issuance costs in connection with the refinancing of certain aircraft equipment notes and a loan prepayment,
offset in part by $8 million in gains on forgiveness of debt.
55