US Airways 2010 Annual Report Download - page 43
Download and view the complete annual report
Please find page 43 of the 2010 US Airways annual report below. You can navigate through the pages in the report by either clicking on the pages listed below, or by using the keyword search tool below to find specific information within the annual report.-
 1
1 -
2
-
3
-
4
-
5
-
6
-
7
-
8
-
9
-
10
-
11
-
12
-
13
-
14
-
15
-
16
-
17
-
18
-
19
-
20
-
21
-
22
-
23
-
24
-
25
-
26
-
27
-
28
-
29
-
30
-
31
-
32
-
 33
33 -
 34
34 -
 35
35 -
 36
36 -
 37
37 -
 38
38 -
 39
39 -
 40
40 -
 41
41 -
 42
42 -
 43
43 -
 44
44 -
 45
45 -
 46
46 -
 47
47 -
 48
48 -
 49
49 -
 50
50 -
 51
51 -
 52
52 -
 53
53 -
54
-
55
-
56
-
57
-
58
-
59
-
60
-
61
-
62
-
63
-
64
-
65
-
66
-
67
-
68
-
69
-
70
-
71
-
72
-
73
-
74
-
75
-
76
-
77
-
78
-
79
-
80
-
81
-
82
-
83
-
84
-
85
-
86
-
87
-
88
-
89
-
90
-
91
-
92
-
93
-
94
-
95
-
96
-
97
-
98
-
99
-
100
-
101
-
102
-
103
-
104
-
105
-
106
-
107
-
108
-
109
-
110
-
111
-
112
-
113
-
114
-
115
-
116
-
117
-
118
-
119
-
120
-
121
-
122
-
123
-
124
-
125
-
126
-
127
-
128
-
129
-
130
-
131
-
132
-
133
-
134
-
135
-
136
-
137
-
138
-
139
-
140
-
141
-
142
-
143
-
144
-
145
-
146
-
147
-
148
-
149
-
150
-
151
-
152
-
153
-
154
-
155
-
156
-
157
-
158
-
159
-
160
-
161
-
162
-
163
-
164
-
165
-
166
-
167
-
168
-
169
 |
 |

Table of Contents
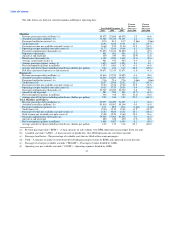
(g) Passenger enplanements – The number of passengers on board an aircraft, including local, connecting and through passengers.
(h) Block hours – The hours measured from the moment an aircraft first moves under its own power, including taxi time, for the
purposes of flight until the aircraft is docked at the next point of landing and its power is shut down.
(i) Average stage length – The average of the distances flown on each segment of every route.
(j) Average passenger journey – The average one-way trip measured in miles for one passenger origination.
(k) Express statistics include Piedmont and PSA, as well as operating and financial results from capacity purchase agreements with Air
Wisconsin Airlines Corporation, Republic Airline Inc., Mesa Airlines, Inc. and Chautauqua Airlines, Inc.
(l) Total revenue per available seat mile ("RASM") – Total revenues divided by total mainline and Express ASMs.
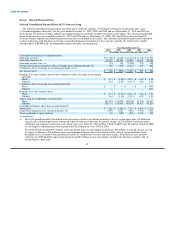
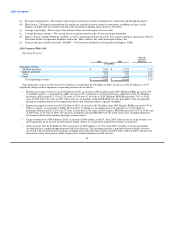
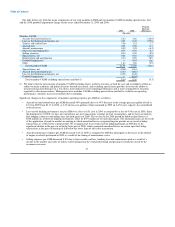
2010 Compared With 2009
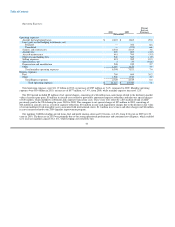
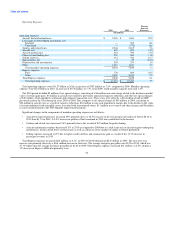
Operating Revenues:
Percent
Increase
2010 2009 (Decrease)
(In millions)
Operating revenues:
Mainline passenger $ 7,645 $ 6,752 13.2
Express passenger 2,821 2,503 12.7
Cargo 149 100 48.8
Other 1,293 1,103 17.2
Total operating revenues $ 11,908 $ 10,458 13.9
Total operating revenues in 2010 were $11.91 billion as compared to $10.46 billion in 2009, an increase of $1.45 billion or 13.9%.
Significant changes in the components of operating revenues are as follows:
• Mainline passenger revenues were $7.65 billion in 2010, an increase of $893 million from 2009. Mainline RPMs increased 1.9%
as mainline capacity, as measured by ASMs, increased 1.2%, resulting in a 0.5 point increase in load factor to 82.4%. Mainline
passenger yield increased 11.1% to 12.96 cents in 2010 from 11.66 cents in 2009. Mainline PRASM increased 11.9% to 10.68
cents in 2010 from 9.55 cents in 2009. These increases in mainline yield and PRASM were due principally to the strengthened
pricing environment driven by the improved economy and continued industry capacity discipline.
• Express passenger revenues were $2.82 billion in 2010, an increase of $318 million from 2009. Express RPMs increased 0.4% as
Express capacity, as measured by ASMs, decreased 1%, resulting in a one point increase in load factor to 74.6%. Express
passenger yield increased 12.2% to 26.57 cents in 2010 from 23.68 cents in 2009. Express PRASM increased 13.8% to 19.83 cents
in 2010 from 17.42 cents in 2009. The increases in Express yield and PRASM were the result of the same strengthened pricing
environment discussed in mainline passenger revenues above.
• Cargo revenues were $149 million in 2010, an increase of $49 million, or 48.8%, from 2009. The increase in cargo revenues was
driven primarily by an increase in international freight volume as a result of the improved economic environment.
• Other revenues were $1.29 billion in 2010, an increase of $190 million, or 17.2%, from 2009. Ancillary revenues, principally
checked bag fees, comprised approximately half of the increase. The remaining increase is primarily related to higher revenues
associated with our frequent flyer program, including increased marketing revenues related to miles sold to business partners and
increased revenues from partner airline frequent flyer award redemptions on US Airways.
42