US Airways 2010 Annual Report Download - page 65
Download and view the complete annual report
Please find page 65 of the 2010 US Airways annual report below. You can navigate through the pages in the report by either clicking on the pages listed below, or by using the keyword search tool below to find specific information within the annual report.-
 1
1 -
2
-
3
-
4
-
5
-
6
-
7
-
8
-
9
-
10
-
11
-
12
-
13
-
14
-
15
-
16
-
17
-
18
-
19
-
20
-
21
-
22
-
23
-
24
-
25
-
26
-
27
-
28
-
29
-
30
-
31
-
32
-
33
-
34
-
35
-
36
-
37
-
38
-
39
-
40
-
41
-
42
-
43
-
44
-
45
-
46
-
47
-
48
-
49
-
50
-
51
-
52
-
53
-
54
-
 55
55 -
 56
56 -
 57
57 -
 58
58 -
 59
59 -
 60
60 -
 61
61 -
 62
62 -
 63
63 -
 64
64 -
 65
65 -
 66
66 -
 67
67 -
 68
68 -
 69
69 -
 70
70 -
 71
71 -
 72
72 -
 73
73 -
 74
74 -
 75
75 -
76
-
77
-
78
-
79
-
80
-
81
-
82
-
83
-
84
-
85
-
86
-
87
-
88
-
89
-
90
-
91
-
92
-
93
-
94
-
95
-
96
-
97
-
98
-
99
-
100
-
101
-
102
-
103
-
104
-
105
-
106
-
107
-
108
-
109
-
110
-
111
-
112
-
113
-
114
-
115
-
116
-
117
-
118
-
119
-
120
-
121
-
122
-
123
-
124
-
125
-
126
-
127
-
128
-
129
-
130
-
131
-
132
-
133
-
134
-
135
-
136
-
137
-
138
-
139
-
140
-
141
-
142
-
143
-
144
-
145
-
146
-
147
-
148
-
149
-
150
-
151
-
152
-
153
-
154
-
155
-
156
-
157
-
158
-
159
-
160
-
161
-
162
-
163
-
164
-
165
-
166
-
167
-
168
-
169
 |
 |

Table of Contents
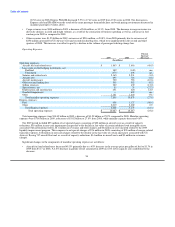
Contractual Obligations
The following table provides details of our future cash contractual obligations as of December 31, 2010 (in millions):
Payments Due by Period
2011 2012 2013 2014 2015 Thereafter Total
US Airways Group (1)
Debt (2) $ 16 $ 116 $ 116 $ 1,276 $ — $ 35 $ 1,559
Interest obligations (3) 57 54 49 24 3 23 210
US Airways (4)
Debt and capital lease obligations (5) (6) 381 339 301 279 279 1,479 3,058
Interest obligations (3) (6) 151 147 116 99 101 309 923
Aircraft purchase and operating lease commitments (7) 1,547 1,520 1,891 1,598 1,016 4,737 12,309
Regional capacity purchase agreements (8) 1,005 1,009 1,011 1,016 898 1,385 6,324
Other US Airways Group subsidiaries (9) 11 9 8 6 1 — 35
Total $ 3,168 $ 3,194 $ 3,492 $ 4,298 $ 2,298 $ 7,968 $ 24,418
(1) These commitments represent those entered into by US Airways Group.
(2) Excludes $136 million of unamortized debt discount as of December 31, 2010.
(3) For variable-rate debt, future interest obligations are shown above using interest rates in effect as of December 31, 2010.
(4) These commitments represent those entered into by US Airways.
(5) Excludes $81 million of unamortized debt discount as of December 31, 2010.
(6) Includes $809 million of future principal payments and $339 million of future interest payments as of December 31, 2010,
respectively, related to pass through trust certificates or EETCs associated with mortgage financings for the purchase of certain
aircraft as described under "Off-Balance Sheet Arrangements" and in Note 9(c) to US Airways Group's and Note 8(c) to US Airways'
consolidated financial statements in Item 8A and 8B of this report, respectively.
(7) Includes $2.96 billion of future minimum lease payments related to EETC leveraged leased financings of certain aircraft as of
December 31, 2010, as described under "Off-Balance Sheet Arrangements" and in Note 9(c) to US Airways Group's and Note 8(c) to
US Airways' consolidated financial statements in Item 8A and 8B of this report, respectively.
(8) Represents minimum payments under capacity purchase agreements with third-party Express carriers.
(9) Represents operating lease commitments entered into by US Airways Group's other airline subsidiaries, Piedmont and PSA.
We expect to fund these cash obligations from funds provided by operations and future financings, if necessary. The cash available to
us from these sources, however, may not be sufficient to cover these cash obligations because economic factors may reduce the amount
of cash generated by operations or increase our costs. For instance, an economic downturn or general global instability caused by military
actions, terrorism, disease outbreaks and natural disasters could reduce the demand for air travel, which would reduce the amount of cash
generated by operations. An increase in our costs, either due to an increase in borrowing costs caused by a reduction in our credit rating
or a general increase in interest rates or due to an increase in the cost of fuel, maintenance, aircraft and aircraft engines and parts, could
decrease the amount of cash available to cover the cash obligations. Moreover, the Citicorp credit facility, our amended credit card
agreement with Barclays and certain of our other financing arrangements contain significant minimum cash balance requirements. As a
result, we cannot use all of our available cash to fund operations, capital expenditures and cash obligations without violating these
requirements.
64