US Airways 2010 Annual Report Download - page 32
Download and view the complete annual report
Please find page 32 of the 2010 US Airways annual report below. You can navigate through the pages in the report by either clicking on the pages listed below, or by using the keyword search tool below to find specific information within the annual report.-
 1
1 -
2
-
3
-
4
-
5
-
6
-
7
-
8
-
9
-
10
-
11
-
12
-
13
-
14
-
15
-
16
-
17
-
18
-
19
-
20
-
21
-
 22
22 -
 23
23 -
 24
24 -
 25
25 -
 26
26 -
 27
27 -
 28
28 -
 29
29 -
 30
30 -
 31
31 -
 32
32 -
 33
33 -
 34
34 -
 35
35 -
 36
36 -
 37
37 -
 38
38 -
 39
39 -
 40
40 -
 41
41 -
 42
42 -
43
-
44
-
45
-
46
-
47
-
48
-
49
-
50
-
51
-
52
-
53
-
54
-
55
-
56
-
57
-
58
-
59
-
60
-
61
-
62
-
63
-
64
-
65
-
66
-
67
-
68
-
69
-
70
-
71
-
72
-
73
-
74
-
75
-
76
-
77
-
78
-
79
-
80
-
81
-
82
-
83
-
84
-
85
-
86
-
87
-
88
-
89
-
90
-
91
-
92
-
93
-
94
-
95
-
96
-
97
-
98
-
99
-
100
-
101
-
102
-
103
-
104
-
105
-
106
-
107
-
108
-
109
-
110
-
111
-
112
-
113
-
114
-
115
-
116
-
117
-
118
-
119
-
120
-
121
-
122
-
123
-
124
-
125
-
126
-
127
-
128
-
129
-
130
-
131
-
132
-
133
-
134
-
135
-
136
-
137
-
138
-
139
-
140
-
141
-
142
-
143
-
144
-
145
-
146
-
147
-
148
-
149
-
150
-
151
-
152
-
153
-
154
-
155
-
156
-
157
-
158
-
159
-
160
-
161
-
162
-
163
-
164
-
165
-
166
-
167
-
168
-
169
 |
 |
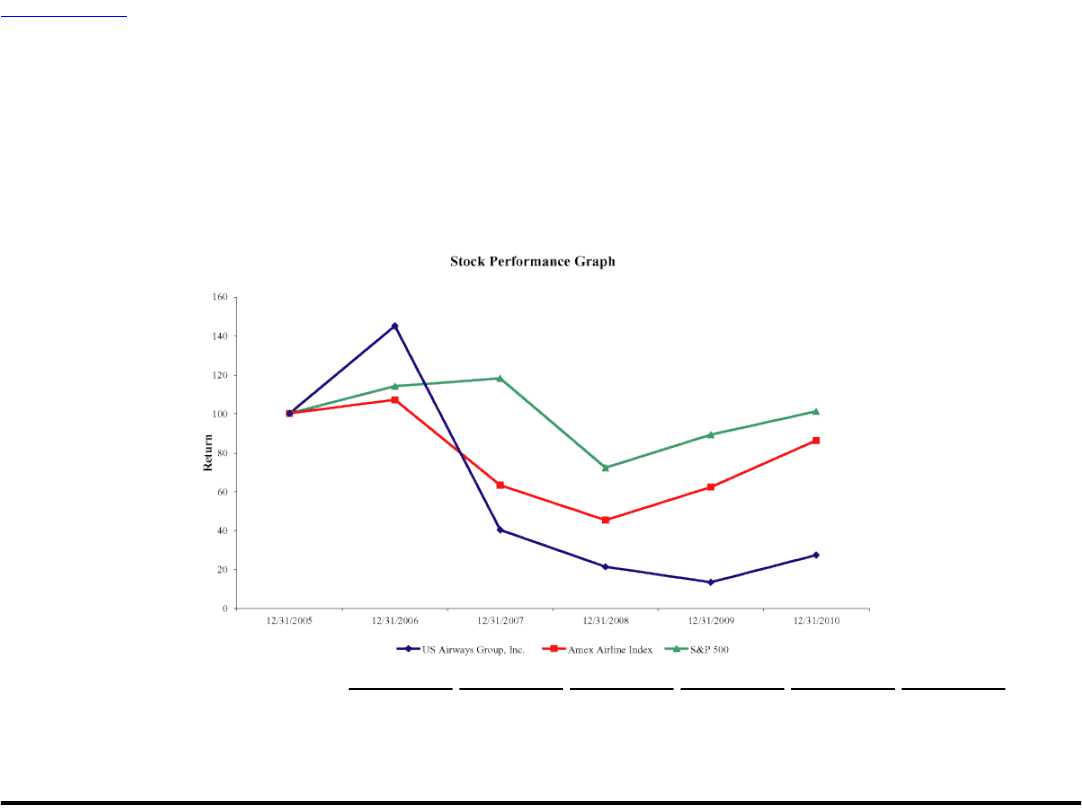
Table of Contents
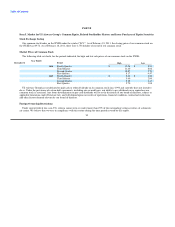
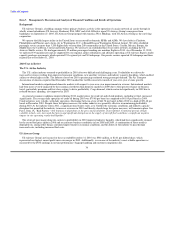
Stock Performance Graph
The following stock performance graph and related information shall not be deemed "soliciting material" or "filed" with the Securities
and Exchange Commission, nor shall such information be incorporated by reference into any future filings under the Securities Act of
1933 or the Exchange Act, each as amended, except to the extent that we specifically incorporate it by reference into such filing.
The following stock performance graph compares our cumulative total shareholder return on an annual basis on our common stock
with the cumulative total return on the Standard and Poor's 500 Stock Index and the AMEX Airline Index from December 31, 2005
through December 31, 2010. The comparison assumes $100 was invested on December 31, 2005 in US Airways Group common stock
and in each of the foregoing indices and assumes reinvestment of dividends. The stock performance shown on the graph below represents
historical stock performance and is not necessarily indicative of future stock price performance.
12/31/2005 12/31/2006 12/31/2007 12/31/2008 12/31/2009 12/31/2010
US Airways Group, Inc. $ 100 $ 145 $ 40 $ 21 $ 13 $ 27
Amex Airline Index 100 107 63 45 62 86
S&P 500 100 114 118 72 89 101
31