US Airways 2010 Annual Report Download - page 35
Download and view the complete annual report
Please find page 35 of the 2010 US Airways annual report below. You can navigate through the pages in the report by either clicking on the pages listed below, or by using the keyword search tool below to find specific information within the annual report.-
 1
1 -
2
-
3
-
4
-
5
-
6
-
7
-
8
-
9
-
10
-
11
-
12
-
13
-
14
-
15
-
16
-
17
-
18
-
19
-
20
-
21
-
22
-
23
-
24
-
 25
25 -
 26
26 -
 27
27 -
 28
28 -
 29
29 -
 30
30 -
 31
31 -
 32
32 -
 33
33 -
 34
34 -
 35
35 -
 36
36 -
 37
37 -
 38
38 -
 39
39 -
 40
40 -
 41
41 -
 42
42 -
 43
43 -
 44
44 -
 45
45 -
46
-
47
-
48
-
49
-
50
-
51
-
52
-
53
-
54
-
55
-
56
-
57
-
58
-
59
-
60
-
61
-
62
-
63
-
64
-
65
-
66
-
67
-
68
-
69
-
70
-
71
-
72
-
73
-
74
-
75
-
76
-
77
-
78
-
79
-
80
-
81
-
82
-
83
-
84
-
85
-
86
-
87
-
88
-
89
-
90
-
91
-
92
-
93
-
94
-
95
-
96
-
97
-
98
-
99
-
100
-
101
-
102
-
103
-
104
-
105
-
106
-
107
-
108
-
109
-
110
-
111
-
112
-
113
-
114
-
115
-
116
-
117
-
118
-
119
-
120
-
121
-
122
-
123
-
124
-
125
-
126
-
127
-
128
-
129
-
130
-
131
-
132
-
133
-
134
-
135
-
136
-
137
-
138
-
139
-
140
-
141
-
142
-
143
-
144
-
145
-
146
-
147
-
148
-
149
-
150
-
151
-
152
-
153
-
154
-
155
-
156
-
157
-
158
-
159
-
160
-
161
-
162
-
163
-
164
-
165
-
166
-
167
-
168
-
169
 |
 |

Table of Contents
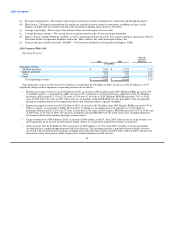
(c) The 2006 period included a $1 million benefit, which represents the cumulative effect on the accumulated deficit of the adoption of
new share-based payment accounting guidance. The adjustment reflects the impact of estimating future forfeitures for previously
recognized compensation expense.
(d) Includes debt, capital leases, postretirement benefits other than pensions and employee benefit liabilities and other.
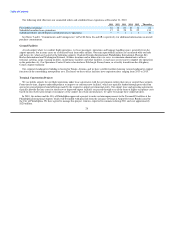
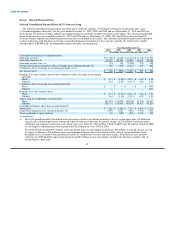
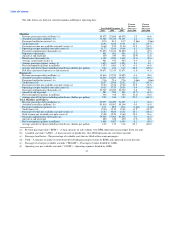
Selected Consolidated Financial Data of US Airways
The selected consolidated financial data presented below under the captions "Consolidated statements of operations data" and
"Consolidated balance sheet data" for the years ended December 31, 2010, 2009 and 2008 and as of December 31, 2010 and 2009 are
derived from US Airways' audited consolidated financial statements included elsewhere in this report. The selected consolidated financial
data for the years ended December 31, 2007 and 2006 and as of December 31, 2008, 2007 and 2006 are derived from US Airways'
audited consolidated financial statements not included in this report. The selected consolidated financial data should be read in
conjunction with US Airways' consolidated financial statements for the respective periods, the related notes and the related reports of
KPMG LLP, an independent registered public accounting firm.
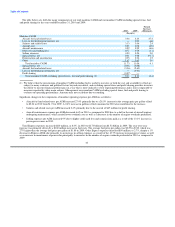
Year Ended December 31,
2010 2009 2008 2007 2006
(In millions)
Consolidated statements of operations data:
Operating revenues $ 12,055 $ 10,609 $ 12,244 $ 11,813 $ 11,692
Operating expenses (a) 11,274 10,487 14,017 11,289 11,135
Operating income (loss) (a) 781 122 (1,773) 524 557
Income (loss) before cumulative effect of change in accounting principle (b) 599 (140) (2,148) 478 348
Cumulative effect of change in accounting principle, net (c) — — — — 1
Net income (loss) $ 599 $ (140) $ (2,148) $ 478 $ 349
Consolidated balance sheet data (at end of period):
Total assets $ 7,565 $ 7,123 $ 6,954 $ 7,787 $ 7,351
Long-term obligations, less current maturities (d) 3,130 3,266 2,867 2,013 2,131
Total stockholder's equity (deficit) 780 255 (221) 1,850 (461)
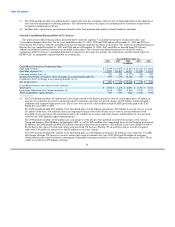
(a) The 2010 period included a $6 million non-cash charge related to the decline in market value of certain spare parts, $5 million in
aircraft costs related to previously announced capacity reductions and other net special charges of $10 million, which included a
settlement and corporate transaction costs. These costs were offset by a $16 million refund of ASIF previously paid to the TSA
during the years 2005 to 2009.
The 2009 period included $375 million of net unrealized gains on fuel hedging instruments, $22 million in aircraft costs as a result
of capacity reductions, $16 million in non-cash impairment charges due to the decline in fair value of certain indefinite lived
intangible assets associated with international routes, $11 million in severance and other charges and $6 million in costs incurred
related to the 2009 liquidity improvement program.
The 2008 period included a $622 million non-cash charge to write off all of the goodwill created by the merger of US Airways
Group and America West Holdings in September 2005, as well as $496 million of net unrealized losses on fuel hedging instruments.
In addition, the 2008 period included $35 million of merger-related transition expenses, $18 million in non-cash charges related to
the decline in fair value of certain spare parts associated with US Airways' Boeing 737 aircraft fleet and, as a result of capacity
reductions, $14 million in aircraft costs and $9 million in severance charges.
The 2007 period included $187 million of net unrealized gains on fuel hedging instruments, $7 million in tax credits due to an IRS
rule change allowing US Airways to recover certain fuel usage tax amounts for years 2003-2006 and $9 million of insurance
settlement proceeds related to business interruption and property damages incurred as a result of Hurricane Katrina in 2005. These
credits were offset by $99 million of merger-
34