US Airways 2010 Annual Report Download - page 39
Download and view the complete annual report
Please find page 39 of the 2010 US Airways annual report below. You can navigate through the pages in the report by either clicking on the pages listed below, or by using the keyword search tool below to find specific information within the annual report.-
 1
1 -
2
-
3
-
4
-
5
-
6
-
7
-
8
-
9
-
10
-
11
-
12
-
13
-
14
-
15
-
16
-
17
-
18
-
19
-
20
-
21
-
22
-
23
-
24
-
25
-
26
-
27
-
28
-
 29
29 -
 30
30 -
 31
31 -
 32
32 -
 33
33 -
 34
34 -
 35
35 -
 36
36 -
 37
37 -
 38
38 -
 39
39 -
 40
40 -
 41
41 -
 42
42 -
 43
43 -
 44
44 -
 45
45 -
 46
46 -
 47
47 -
 48
48 -
 49
49 -
50
-
51
-
52
-
53
-
54
-
55
-
56
-
57
-
58
-
59
-
60
-
61
-
62
-
63
-
64
-
65
-
66
-
67
-
68
-
69
-
70
-
71
-
72
-
73
-
74
-
75
-
76
-
77
-
78
-
79
-
80
-
81
-
82
-
83
-
84
-
85
-
86
-
87
-
88
-
89
-
90
-
91
-
92
-
93
-
94
-
95
-
96
-
97
-
98
-
99
-
100
-
101
-
102
-
103
-
104
-
105
-
106
-
107
-
108
-
109
-
110
-
111
-
112
-
113
-
114
-
115
-
116
-
117
-
118
-
119
-
120
-
121
-
122
-
123
-
124
-
125
-
126
-
127
-
128
-
129
-
130
-
131
-
132
-
133
-
134
-
135
-
136
-
137
-
138
-
139
-
140
-
141
-
142
-
143
-
144
-
145
-
146
-
147
-
148
-
149
-
150
-
151
-
152
-
153
-
154
-
155
-
156
-
157
-
158
-
159
-
160
-
161
-
162
-
163
-
164
-
165
-
166
-
167
-
168
-
169
 |
 |

Table of Contents
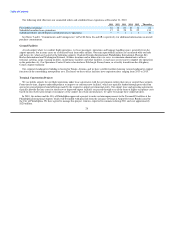
The year ended December 31, 2010 marked a year of outstanding operational performance for US Airways. We received twelve first
place rankings, the most among the hub and spoke carriers, in three critical DOT monthly metrics including six first place rankings in
baggage handling, three first place rankings in on-time performance and three first place rankings for the lowest customer complaints
ratio.
On a full year basis as measured by the DOT, we ranked first in baggage handling and second in on-time performance. The
combination of continued strong on-time performance and fewer mishandled bags contributed to an overall 2010 customer complaints
ratio that was 10% better than the average of our hub and spoke peers.
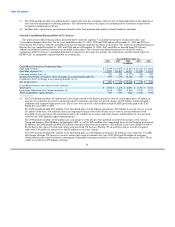
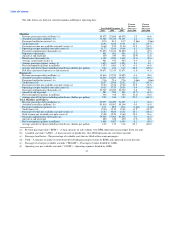
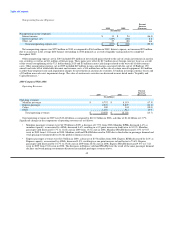
We reported the following operating statistics to the DOT for mainline operations for the years ended December 31, 2010 and 2009:
Percent
Better
2010 2009 (Worse)
On-time performance (a) 83.0 80.9 2.6
Completion factor (b) 98.5 98.8 (0.3)
Mishandled baggage (c) 2.56 3.03 15.5
Customer complaints (d) 1.53 1.31 (16.8)
(a) Percentage of reported flight operations arriving on time as defined by the DOT.
(b) Percentage of scheduled flight operations completed.
(c) Rate of mishandled baggage reports per 1,000 passengers.
(d) Rate of customer complaints filed with the DOT per 100,000 passengers.
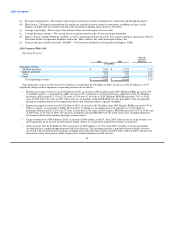
Liquidity Position
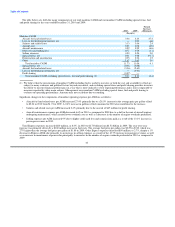
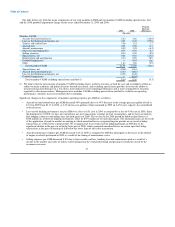
As of December 31, 2010, our cash, cash equivalents, investments in marketable securities and restricted cash were $2.28 billion, of
which $364 million was restricted.
December 31, December 31,
2010 2009
(In millions)
Cash and cash equivalents $ 1,859 $ 1,299
Long-term restricted cash 364 480
Long-term investments in marketable securities 57 203
Total cash, cash equivalents, investments in marketable securities and restricted cash $ 2,280 $ 1,982
During 2010, our profitability drove a $298 million improvement in our liquidity position. This improvement is net of a repurchase of
$69 million of our 7% Senior Convertible Notes (the "7% notes") in 2010.
As of December 31, 2010, our investments in marketable securities included $57 million ($84 million par value) of auction rate
securities that are classified as noncurrent assets on our consolidated balance sheets. The reduction in long-term investments during 2010
was due principally to sales of $145 million of auction rate securities. Proceeds from our auction rate security sale transactions
approximated the carrying amount of those investments.
Long-term restricted cash primarily includes cash collateral to secure workers' compensation claims and credit card processing
holdback requirements for advance ticket sales for which US Airways has not yet provided air transportation. The decrease in restricted
cash during 2010 was primarily due to a reduction in the amount of credit card holdback.
2011 Outlook
Looking forward it is difficult to predict the price of oil, the pace at which the economy will continue to recover or the capacity actions
of other airlines, which may impact the ability to obtain higher yields. Over the past few years we have taken significant and decisive
actions to maintain capacity that is in line with demand, realign our network to focus on key markets, introduce new revenue streams,
control costs and continue our commitment to exceptional operating reliability. We believe these actions have positioned us well as we
enter 2011.
38