US Airways 2010 Annual Report Download - page 48
Download and view the complete annual report
Please find page 48 of the 2010 US Airways annual report below. You can navigate through the pages in the report by either clicking on the pages listed below, or by using the keyword search tool below to find specific information within the annual report.-
 1
1 -
2
-
3
-
4
-
5
-
6
-
7
-
8
-
9
-
10
-
11
-
12
-
13
-
14
-
15
-
16
-
17
-
18
-
19
-
20
-
21
-
22
-
23
-
24
-
25
-
26
-
27
-
28
-
29
-
30
-
31
-
32
-
33
-
34
-
35
-
36
-
37
-
 38
38 -
 39
39 -
 40
40 -
 41
41 -
 42
42 -
 43
43 -
 44
44 -
 45
45 -
 46
46 -
 47
47 -
 48
48 -
 49
49 -
 50
50 -
 51
51 -
 52
52 -
 53
53 -
 54
54 -
 55
55 -
 56
56 -
 57
57 -
 58
58 -
59
-
60
-
61
-
62
-
63
-
64
-
65
-
66
-
67
-
68
-
69
-
70
-
71
-
72
-
73
-
74
-
75
-
76
-
77
-
78
-
79
-
80
-
81
-
82
-
83
-
84
-
85
-
86
-
87
-
88
-
89
-
90
-
91
-
92
-
93
-
94
-
95
-
96
-
97
-
98
-
99
-
100
-
101
-
102
-
103
-
104
-
105
-
106
-
107
-
108
-
109
-
110
-
111
-
112
-
113
-
114
-
115
-
116
-
117
-
118
-
119
-
120
-
121
-
122
-
123
-
124
-
125
-
126
-
127
-
128
-
129
-
130
-
131
-
132
-
133
-
134
-
135
-
136
-
137
-
138
-
139
-
140
-
141
-
142
-
143
-
144
-
145
-
146
-
147
-
148
-
149
-
150
-
151
-
152
-
153
-
154
-
155
-
156
-
157
-
158
-
159
-
160
-
161
-
162
-
163
-
164
-
165
-
166
-
167
-
168
-
169
 |
 |
Table of Contents
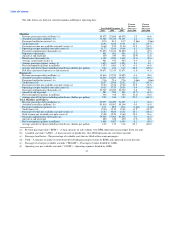
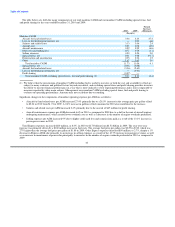
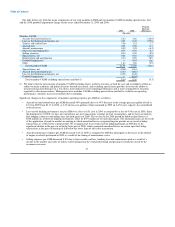
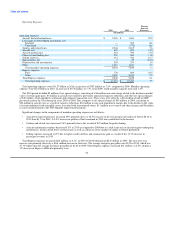
The table below sets forth the major components of our total mainline CASM and our mainline CASM excluding special items, fuel
and the 2008 goodwill impairment charge for the years ended December 31, 2009 and 2008:
Percent
Increase
2009 2008 (Decrease)
(In cents)
Mainline CASM:
Aircraft fuel and related taxes 2.63 4.88 (46.0)
Loss on fuel hedging instruments, net 0.01 0.48 (97.8)
Salaries and related costs 3.06 3.01 1.7
Aircraft rent 0.98 0.98 0.7
Aircraft maintenance 0.99 1.05 (6.2)
Other rent and landing fees 0.79 0.76 4.4
Selling expenses 0.54 0.59 (8.8)
Special items, net 0.08 0.10 (23.8)
Depreciation and amortization 0.34 0.29 18.0
Goodwill impairment — 0.84 nm
Other 1.63 1.68 (2.9)
Total mainline CASM 11.06 14.66 (24.6)
Special items, net (0.08) (0.10)
Aircraft fuel and related taxes (2.63) (4.88)
Loss on fuel hedging instruments, net (0.01) (0.48)
Goodwill impairment — (0.84)
Total mainline CASM excluding special items and fuel (1) 8.34 8.36 (0.3)
(1) We believe that the presentation of mainline CASM excluding fuel is useful to investors as both the cost and availability of fuel are
subject to many economic and political factors beyond our control, and excluding special items provides investors the ability to
measure financial performance in a way that is more indicative of our ongoing performance and is more comparable to measures
reported by other major airlines. Management uses mainline CASM excluding special items and fuel to evaluate our operating
performance. Amounts may not recalculate due to rounding.
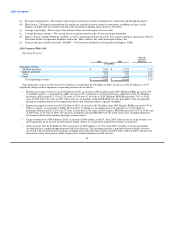
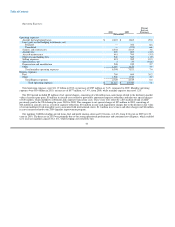
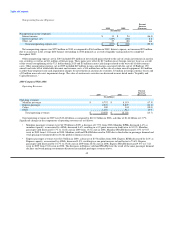
Significant changes in the components of mainline operating expense per ASM are as follows:
• Aircraft fuel and related taxes per ASM decreased 46% primarily due to a 45% decrease in the average price per gallon of fuel to
$1.74 in 2009 from $3.17 in 2008. A 6.4% decrease in gallons of fuel consumed in 2009 on 4.6% lower capacity also contributed
to the decrease.
• Loss on fuel hedging instruments, net per ASM was a loss of 0.01 cent in 2009 as compared to a loss of 0.48 cents in 2008. Since
the third quarter of 2008, we have not entered into any new transactions to hedge our fuel consumption, and we have not had any
fuel hedging contracts outstanding since the third quarter of 2009. The net loss in the 2009 period included realized losses of
$382 million on settled fuel hedging instruments, offset by $375 million of net unrealized gains. The unrealized gains are the result
of the application of mark-to-market accounting in which unrealized losses recognized in prior periods are reversed as hedge
transactions are settled in the current period. We recognized net losses from our fuel hedging program in 2008 due to the
significant decline in the price of oil in the latter part of 2008, which generated unrealized losses on certain open fuel hedge
transactions as the price of heating oil fell below the lower limit of our collar transactions.
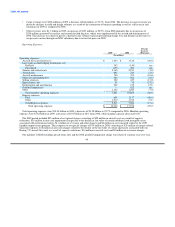
• Aircraft maintenance expense per ASM decreased 6.2% in 2009 as compared to 2008 due principally to decreases in the number
of engine overhauls performed in 2009 as a result of the timing of maintenance cycles.
• Selling expenses per ASM decreased 8.8% due to lower credit card fees, booking fees and commissions paid as a result of a
decline in the number and value of tickets sold resulting from the weakened demand and pricing environment caused by the
economic recession.
47