US Airways 2010 Annual Report Download - page 53
Download and view the complete annual report
Please find page 53 of the 2010 US Airways annual report below. You can navigate through the pages in the report by either clicking on the pages listed below, or by using the keyword search tool below to find specific information within the annual report.-
 1
1 -
2
-
3
-
4
-
5
-
6
-
7
-
8
-
9
-
10
-
11
-
12
-
13
-
14
-
15
-
16
-
17
-
18
-
19
-
20
-
21
-
22
-
23
-
24
-
25
-
26
-
27
-
28
-
29
-
30
-
31
-
32
-
33
-
34
-
35
-
36
-
37
-
38
-
39
-
40
-
41
-
42
-
 43
43 -
 44
44 -
 45
45 -
 46
46 -
 47
47 -
 48
48 -
 49
49 -
 50
50 -
 51
51 -
 52
52 -
 53
53 -
 54
54 -
 55
55 -
 56
56 -
 57
57 -
 58
58 -
 59
59 -
 60
60 -
 61
61 -
 62
62 -
 63
63 -
64
-
65
-
66
-
67
-
68
-
69
-
70
-
71
-
72
-
73
-
74
-
75
-
76
-
77
-
78
-
79
-
80
-
81
-
82
-
83
-
84
-
85
-
86
-
87
-
88
-
89
-
90
-
91
-
92
-
93
-
94
-
95
-
96
-
97
-
98
-
99
-
100
-
101
-
102
-
103
-
104
-
105
-
106
-
107
-
108
-
109
-
110
-
111
-
112
-
113
-
114
-
115
-
116
-
117
-
118
-
119
-
120
-
121
-
122
-
123
-
124
-
125
-
126
-
127
-
128
-
129
-
130
-
131
-
132
-
133
-
134
-
135
-
136
-
137
-
138
-
139
-
140
-
141
-
142
-
143
-
144
-
145
-
146
-
147
-
148
-
149
-
150
-
151
-
152
-
153
-
154
-
155
-
156
-
157
-
158
-
159
-
160
-
161
-
162
-
163
-
164
-
165
-
166
-
167
-
168
-
169
 |
 |

Table of Contents
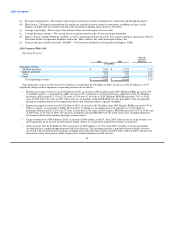
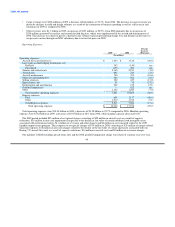
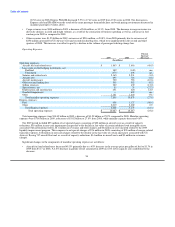
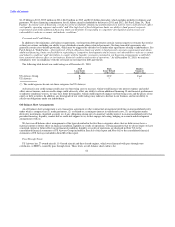
Operating Expenses:
Percent
Increase
2010 2009 (Decrease)
(In millions)
Operating expenses:
Aircraft fuel and related taxes $ 2,403 $ 1,863 29.0
Loss (gain) on fuel hedging instruments, net:
Realized — 382 nm
Unrealized — (375) nm
Salaries and related costs 2,244 2,165 3.6
Aircraft rent 670 695 (3.7)
Aircraft maintenance 661 700 (5.5)
Other rent and landing fees 549 560 (1.9)
Selling expenses 421 382 10.3
Special items, net 5 55 (91.6)
Depreciation and amortization 258 251 2.6
Other 1,223 1,181 3.6
Total mainline operating expenses 8,434 7,859 7.3
Express expenses:
Fuel 770 609 26.5
Other 2,070 2,019 2.5
Total Express expenses 2,840 2,628 8.1
Total operating expenses $ 11,274 $ 10,487 7.5
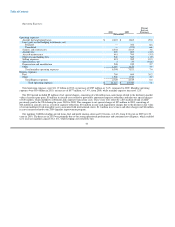
Total operating expenses were $11.27 billion in 2010, an increase of $787 million, or 7.5%, compared to 2009. Mainline operating
expenses were $8.43 billion in 2010, an increase of $575 million, or 7.3%, from 2009, while mainline capacity increased 1.2%.
The 2010 period included $5 million of net special charges, consisting of a $6 million non-cash charge related to the decline in market
value of certain spare parts, $5 million in aircraft costs related to previously announced capacity reductions and other net special charges
of $10 million, which included a settlement and corporate transaction costs. These costs were offset by a $16 million refund of ASIF
previously paid to the TSA during the years 2005 to 2009. This compares to net special charges of $55 million in 2009, consisting of
$22 million in aircraft costs as a result of capacity reductions, $16 million in non-cash impairment charges due to the decline in fair value
of certain indefinite lived intangible assets associated with international routes, $11 million in severance and other charges and $6 million
in costs incurred related to the 2009 liquidity improvement program.
Significant changes in the components of mainline operating expense are as follows:
• Aircraft fuel and related taxes increased 29% primarily due to a 28.5% increase in the average price per gallon of fuel to $2.24 in
2010 from $1.74 in 2009. A 0.4% increase in gallons of fuel consumed in 2010 also contributed to the increase.
• Salaries and related costs increased 3.6% primarily due to the accrual of $47 million for profit sharing.
• Aircraft maintenance expense decreased 5.5% in 2010 as compared to 2009 due to a shift in the mix of aircraft engines undergoing
maintenance, which carried lower overhaul costs as well as a decrease in the number of engine overhauls performed.
• Selling expenses increased 10.3% due to higher credit card fees and commissions paid as a result of the 13.1% increase in
passenger revenues in 2010.
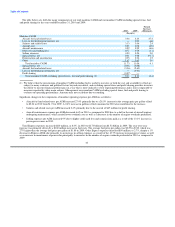
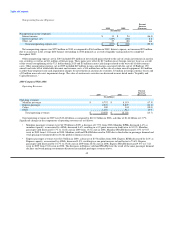
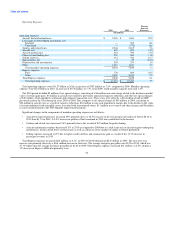
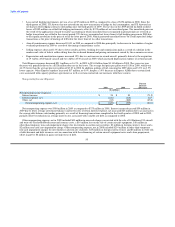
Total Express expenses increased $212 million, or 8.1%, in 2010 to $2.84 billion from $2.63 billion in 2009. The year-over-year
increase was primarily driven by a $161 million increase in fuel costs. The average fuel price per gallon was $2.29 in 2010, which was
27.3% higher than the average fuel price per gallon of $1.80 in 2009. Other Express expenses increased $51 million, or 2.5%, despite a
1% decrease in Express ASMs due primarily to an
52