US Airways 2010 Annual Report Download - page 140
Download and view the complete annual report
Please find page 140 of the 2010 US Airways annual report below. You can navigate through the pages in the report by either clicking on the pages listed below, or by using the keyword search tool below to find specific information within the annual report.-
 1
1 -
2
-
3
-
4
-
5
-
6
-
7
-
8
-
9
-
10
-
11
-
12
-
13
-
14
-
15
-
16
-
17
-
18
-
19
-
20
-
21
-
22
-
23
-
24
-
25
-
26
-
27
-
28
-
29
-
30
-
31
-
32
-
33
-
34
-
35
-
36
-
37
-
38
-
39
-
40
-
41
-
42
-
43
-
44
-
45
-
46
-
47
-
48
-
49
-
50
-
51
-
52
-
53
-
54
-
55
-
56
-
57
-
58
-
59
-
60
-
61
-
62
-
63
-
64
-
65
-
66
-
67
-
68
-
69
-
70
-
71
-
72
-
73
-
74
-
75
-
76
-
77
-
78
-
79
-
80
-
81
-
82
-
83
-
84
-
85
-
86
-
87
-
88
-
89
-
90
-
91
-
92
-
93
-
94
-
95
-
96
-
97
-
98
-
99
-
100
-
101
-
102
-
103
-
104
-
105
-
106
-
107
-
108
-
109
-
110
-
111
-
112
-
113
-
114
-
115
-
116
-
117
-
118
-
119
-
120
-
121
-
122
-
123
-
124
-
125
-
126
-
127
-
128
-
129
-
 130
130 -
 131
131 -
 132
132 -
 133
133 -
 134
134 -
 135
135 -
 136
136 -
 137
137 -
 138
138 -
 139
139 -
 140
140 -
 141
141 -
 142
142 -
 143
143 -
 144
144 -
 145
145 -
 146
146 -
 147
147 -
 148
148 -
 149
149 -
 150
150 -
151
-
152
-
153
-
154
-
155
-
156
-
157
-
158
-
159
-
160
-
161
-
162
-
163
-
164
-
165
-
166
-
167
-
168
-
169
 |
 |
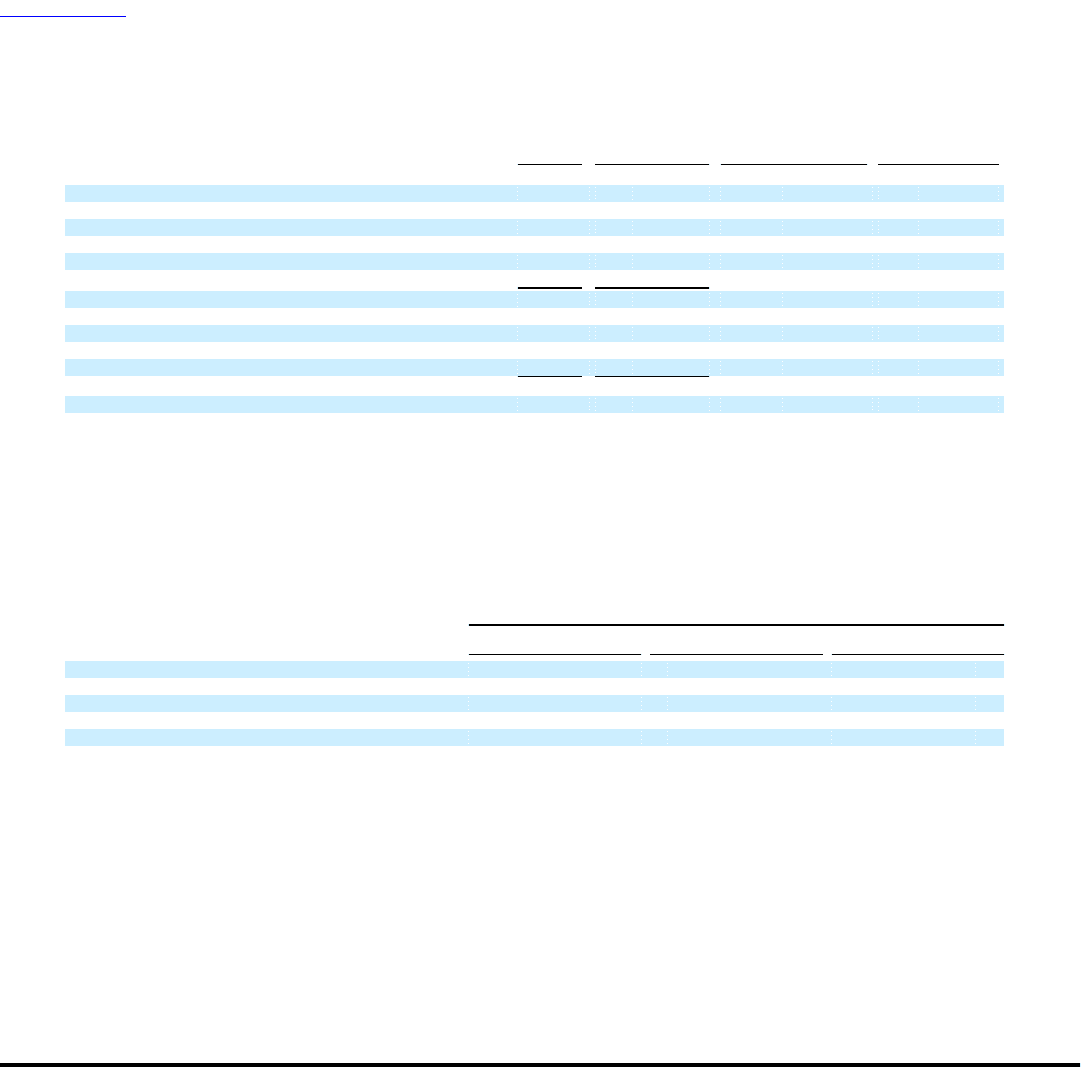
Table of Contents
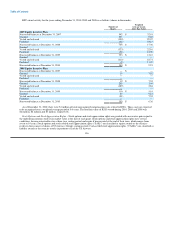
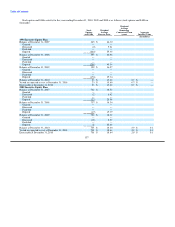
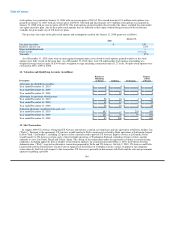
CSARs activity for the years ending December 31, 2010 and 2009 is as follows (CSARs in thousands):
Weighted
Average
Weighted Remaining
Average Contractual Term Aggregate
CSARs Exercise Price (years) Intrinsic Value
(In millions)
2008 Equity Incentive Plan
Balance at December 31, 2008 — $ —
Granted 4,645 3.10
Exercised — —
Forfeited (232) 3.10
Expired — —
Balance at December 31, 2009 4,413 $ 3.10
Granted 1,865 7.42
Exercised (1,028) 3.10
Forfeited (196) 4.15
Expired — —
Balance at December 31, 2010 5,054 $ 4.65 5.6 $ 27.1
Vested or expected to vest at December 31, 2010 4,959 $ 4.63 5.6 $ 26.7
Exercisable at December 31, 2010 438 $ 3.11 5.3 $ 3.0
The fair value of stock options and stock appreciation rights is determined at the grant date using a Black-Scholes option pricing
model, which requires several assumptions. The risk-free interest rate is based on the U.S. Treasury yield curve in effect for the expected
term of the award at the time of grant. The dividend yield is assumed to be zero as US Airways Group does not pay dividends and has no
current plans to do so in the future. The volatility is based on the historical volatility of US Airways Group's common stock over a time
period equal to the expected term of the award. The expected life of the award is based on the historical experience of US Airways. Stock
options and stock appreciation rights are expensed on a straight-line basis over the vesting period for the entire award.
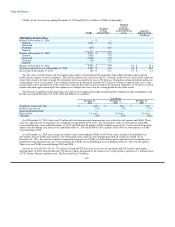
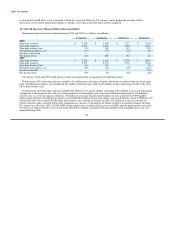
The per share weighted-average grant-date fair value of stock appreciation rights granted and the weighted-average assumptions used
for the years ended December 31, 2010, 2009 and 2008 were as follows:
Year Ended
December 31, December 31, December 31,
2010 2009 2008
Weighted average fair value $ 4.93 $ 1.84 $ 3.28
Risk free interest rate 2.4% 1.3% 2.5%
Expected dividend yield — — —
Expected life 5.0 years 3.0 years 3.0 years
Volatility 81% 92% 62%
As of December 31, 2010, there were $7 million of total unrecognized compensation costs related to stock options and SARs. These
costs are expected to be recognized over a weighted average period of 0.8 years. The total intrinsic value of stock options and SARs
exercised during the years ended December 31, 2010 and 2008 was $5 million and $0.1 million, respectively. Cash received from stock
option exercises during each of the years ended December 31, 2010 and 2008 was $0.1 million. There were no stock options or SARs
exercised during 2009.
As of December 31, 2010, the average fair market value of outstanding CSARs was $7.99 per share and the related liability was
$15 million. These CSARs will continue to be remeasured at fair value at each reporting date until all awards are settled. As of
December 31, 2010, the total unrecognized compensation expense for CSARs was $24 million and is expected to be recognized over a
weighted average period of one year. Total cash paid for CSARs exercised during the year ended December 31, 2010 was $6 million.
There were no CSARs exercised during 2009 and 2008.
Agreements with the Pilot Union – US Airways Group and US Airways have a letter of agreement with US Airways' pilot union
through April 18, 2008, that provides that US Airways' pilots designated by the union receive stock options to purchase 1.1 million shares
of US Airways Group's common stock. The first tranche of 0.5 million
139