US Airways 2010 Annual Report Download - page 55
Download and view the complete annual report
Please find page 55 of the 2010 US Airways annual report below. You can navigate through the pages in the report by either clicking on the pages listed below, or by using the keyword search tool below to find specific information within the annual report.-
 1
1 -
2
-
3
-
4
-
5
-
6
-
7
-
8
-
9
-
10
-
11
-
12
-
13
-
14
-
15
-
16
-
17
-
18
-
19
-
20
-
21
-
22
-
23
-
24
-
25
-
26
-
27
-
28
-
29
-
30
-
31
-
32
-
33
-
34
-
35
-
36
-
37
-
38
-
39
-
40
-
41
-
42
-
43
-
44
-
 45
45 -
 46
46 -
 47
47 -
 48
48 -
 49
49 -
 50
50 -
 51
51 -
 52
52 -
 53
53 -
 54
54 -
 55
55 -
 56
56 -
 57
57 -
 58
58 -
 59
59 -
 60
60 -
 61
61 -
 62
62 -
 63
63 -
 64
64 -
 65
65 -
66
-
67
-
68
-
69
-
70
-
71
-
72
-
73
-
74
-
75
-
76
-
77
-
78
-
79
-
80
-
81
-
82
-
83
-
84
-
85
-
86
-
87
-
88
-
89
-
90
-
91
-
92
-
93
-
94
-
95
-
96
-
97
-
98
-
99
-
100
-
101
-
102
-
103
-
104
-
105
-
106
-
107
-
108
-
109
-
110
-
111
-
112
-
113
-
114
-
115
-
116
-
117
-
118
-
119
-
120
-
121
-
122
-
123
-
124
-
125
-
126
-
127
-
128
-
129
-
130
-
131
-
132
-
133
-
134
-
135
-
136
-
137
-
138
-
139
-
140
-
141
-
142
-
143
-
144
-
145
-
146
-
147
-
148
-
149
-
150
-
151
-
152
-
153
-
154
-
155
-
156
-
157
-
158
-
159
-
160
-
161
-
162
-
163
-
164
-
165
-
166
-
167
-
168
-
169
 |
 |

Table of Contents
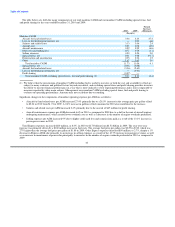
26.52 cents in 2008. Express PRASM decreased 9.5% to 17.42 cents in 2009 from 19.26 cents in 2008. The decreases in
Express yield and PRASM were the result of the same passenger demand declines and weak pricing environment discussed in
mainline passenger revenues above.
• Cargo revenues were $100 million in 2009, a decrease of $44 million, or 30.3%, from 2008. The decrease in cargo revenues was
driven by declines in yield and freight volumes as a result of the contraction of business spending as well as a decrease in fuel
surcharges in 2009 as compared to 2008.
• Other revenues were $1.25 billion in 2009, an increase of $216 million, or 20.8%, from 2008 primarily due to an increase of
$250 million generated by US Airways' first and second checked bag fees, which were implemented in the second and third
quarters of 2008. This increase was offset in part by a decline in the volume of passenger ticketing change fees.
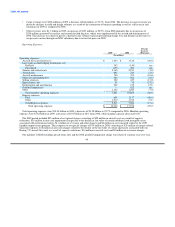
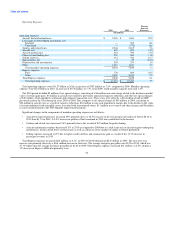
Operating Expenses:
Percent
Increase
2009 2008 (Decrease)
(In millions)
Operating expenses:
Aircraft fuel and related taxes $ 1,863 $ 3,618 (48.5)
Loss (gain) on fuel hedging instruments, net:
Realized 382 (140) nm
Unrealized (375) 496 nm
Salaries and related costs 2,165 2,231 (3.0)
Aircraft rent 695 724 (4.0)
Aircraft maintenance 700 783 (10.6)
Other rent and landing fees 560 562 (0.5)
Selling expenses 382 439 (13.0)
Special items, net 55 76 (27.3)
Depreciation and amortization 251 224 12.0
Goodwill impairment — 622 nm
Other 1,181 1,243 (5.1)
Total mainline operating expenses 7,859 10,878 (27.8)
Express expenses:
Fuel 609 1,137 (46.4)
Other 2,019 2,002 0.9
Total Express expenses 2,628 3,139 (16.3)
Total operating expenses $ 10,487 $ 14,017 (25.2)
Total operating expenses were $10.49 billion in 2009, a decrease of $3.53 billion or 25.2% compared to 2008. Mainline operating
expenses were $7.86 billion in 2009, a decrease of $3.02 billion or 27.8% from 2008, while mainline capacity decreased 4.6%.
The 2009 period included $55 million of net special charges consisting of $22 million in aircraft costs as a result of capacity
reductions, $16 million in non-cash impairment charges due to the decline in fair value of certain indefinite lived intangible assets
associated with international routes, $11 million in severance and other charges and $6 million in costs incurred related to the 2009
liquidity improvement program. This compares to net special charges of $76 million in 2008, consisting of $35 million of merger-related
transition expenses, $18 million in non-cash charges related to the decline in the fair value of certain spare parts associated with US
Airways' Boeing 737 aircraft fleet and, as a result of capacity reductions, $14 million in aircraft costs and $9 million in severance
charges.
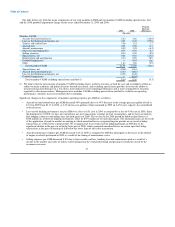
Significant changes in the components of mainline operating expense are as follows:
• Aircraft fuel and related taxes decreased 48.5% primarily due to a 45% decrease in the average price per gallon of fuel to $1.74 in
2009 from $3.17 in 2008. A 6.4% decrease in gallons of fuel consumed in 2009 on 4.6% lower capacity also contributed to the
decrease.
54