US Airways 2010 Annual Report Download - page 128
Download and view the complete annual report
Please find page 128 of the 2010 US Airways annual report below. You can navigate through the pages in the report by either clicking on the pages listed below, or by using the keyword search tool below to find specific information within the annual report.-
 1
1 -
2
-
3
-
4
-
5
-
6
-
7
-
8
-
9
-
10
-
11
-
12
-
13
-
14
-
15
-
16
-
17
-
18
-
19
-
20
-
21
-
22
-
23
-
24
-
25
-
26
-
27
-
28
-
29
-
30
-
31
-
32
-
33
-
34
-
35
-
36
-
37
-
38
-
39
-
40
-
41
-
42
-
43
-
44
-
45
-
46
-
47
-
48
-
49
-
50
-
51
-
52
-
53
-
54
-
55
-
56
-
57
-
58
-
59
-
60
-
61
-
62
-
63
-
64
-
65
-
66
-
67
-
68
-
69
-
70
-
71
-
72
-
73
-
74
-
75
-
76
-
77
-
78
-
79
-
80
-
81
-
82
-
83
-
84
-
85
-
86
-
87
-
88
-
89
-
90
-
91
-
92
-
93
-
94
-
95
-
96
-
97
-
98
-
99
-
100
-
101
-
102
-
103
-
104
-
105
-
106
-
107
-
108
-
109
-
110
-
111
-
112
-
113
-
114
-
115
-
116
-
117
-
 118
118 -
 119
119 -
 120
120 -
 121
121 -
 122
122 -
 123
123 -
 124
124 -
 125
125 -
 126
126 -
 127
127 -
 128
128 -
 129
129 -
 130
130 -
 131
131 -
 132
132 -
 133
133 -
 134
134 -
 135
135 -
 136
136 -
 137
137 -
 138
138 -
139
-
140
-
141
-
142
-
143
-
144
-
145
-
146
-
147
-
148
-
149
-
150
-
151
-
152
-
153
-
154
-
155
-
156
-
157
-
158
-
159
-
160
-
161
-
162
-
163
-
164
-
165
-
166
-
167
-
168
-
169
 |
 |

Table of Contents
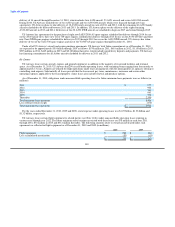
default for each security. These estimated fair values could change significantly based on future market conditions. Refer to
Note 5(b) for further discussion of US Airways' investments in marketable securities.
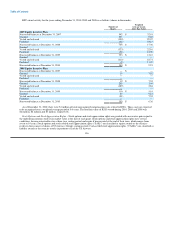
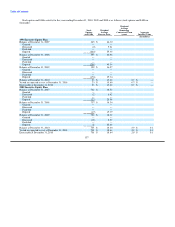
Assets measured at fair value on a recurring basis using significant unobservable inputs (Level 3) are as follows (in millions):
Investments in
Marketable
Securities
(Noncurrent)
Balance at December 31, 2008 $ 187
Net unrealized gains recorded to other comprehensive income 58
Impairment losses included in other nonoperating expense, net (10)
Sales of marketable securities (32)
Balance at December 31, 2009 203
Sales of marketable securities (145)
Net unrealized losses recorded to other comprehensive income (1)
Balance at December 31, 2010 $ 57
Assets measured at fair value on a nonrecurring basis are as follows (in millions):
Quoted Prices in Significant
Active Markets for Significant Other Unobservable
Identical Assets Observable Inputs Inputs Total
Fair Value (Level 1) (Level 2) (Level 3) Losses
At December 31, 2010
International route authorities $ 39 $ — $ — $ 39 $ —
At December 31, 2009
International route authorities $ 39 $ — $ — $ 39 $ (16)
US Airways performed the annual impairment test on its international route authorities during the fourth quarter of 2010. The fair
values of international route authorities were assessed using the market approach. The market approach took into consideration relevant
supply and demand factors at the related airport locations as well as available market sale and lease data. As a result of US Airways'
annual impairment test on international route authorities, no impairment was indicated. In 2009, US Airways recorded $16 million in
non-cash impairment charges related to the decline in fair value of certain international routes.
7. Employee Pension and Benefit Plans
Substantially all of US Airways' employees meeting certain service and other requirements are eligible to participate in various
pension, medical, dental, life insurance, disability and survivorship plans.
127