US Airways 2010 Annual Report Download - page 38
Download and view the complete annual report
Please find page 38 of the 2010 US Airways annual report below. You can navigate through the pages in the report by either clicking on the pages listed below, or by using the keyword search tool below to find specific information within the annual report.-
 1
1 -
2
-
3
-
4
-
5
-
6
-
7
-
8
-
9
-
10
-
11
-
12
-
13
-
14
-
15
-
16
-
17
-
18
-
19
-
20
-
21
-
22
-
23
-
24
-
25
-
26
-
27
-
 28
28 -
 29
29 -
 30
30 -
 31
31 -
 32
32 -
 33
33 -
 34
34 -
 35
35 -
 36
36 -
 37
37 -
 38
38 -
 39
39 -
 40
40 -
 41
41 -
 42
42 -
 43
43 -
 44
44 -
 45
45 -
 46
46 -
 47
47 -
 48
48 -
49
-
50
-
51
-
52
-
53
-
54
-
55
-
56
-
57
-
58
-
59
-
60
-
61
-
62
-
63
-
64
-
65
-
66
-
67
-
68
-
69
-
70
-
71
-
72
-
73
-
74
-
75
-
76
-
77
-
78
-
79
-
80
-
81
-
82
-
83
-
84
-
85
-
86
-
87
-
88
-
89
-
90
-
91
-
92
-
93
-
94
-
95
-
96
-
97
-
98
-
99
-
100
-
101
-
102
-
103
-
104
-
105
-
106
-
107
-
108
-
109
-
110
-
111
-
112
-
113
-
114
-
115
-
116
-
117
-
118
-
119
-
120
-
121
-
122
-
123
-
124
-
125
-
126
-
127
-
128
-
129
-
130
-
131
-
132
-
133
-
134
-
135
-
136
-
137
-
138
-
139
-
140
-
141
-
142
-
143
-
144
-
145
-
146
-
147
-
148
-
149
-
150
-
151
-
152
-
153
-
154
-
155
-
156
-
157
-
158
-
159
-
160
-
161
-
162
-
163
-
164
-
165
-
166
-
167
-
168
-
169
 |
 |

Table of Contents
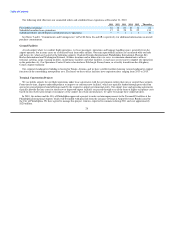
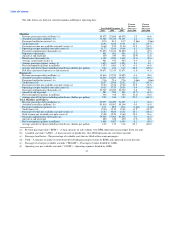
Revenue
We experienced year-over-year growth in revenues driven by higher yields as a result of the improved economy and industry capacity
discipline. Mainline and Express passenger revenues increased $1.21 billion, or 13.1%, as compared to the 2009 period. The increase in
passenger revenues was driven by an 11.2% increase in yields as compared to 2009. Our mainline and Express passenger revenue per
available seat mile ("PRASM") was 12.20 cents in 2010, a 12.1% increase as compared to 10.88 cents in 2009. Total revenue per
available seat mile ("RASM") increased by a greater amount. RASM was 13.88 cents in 2010, as compared to 12.29 cents in 2009,
representing a 12.9% improvement. Total revenues benefited from our ancillary revenue initiatives, which generated $514 million in
revenues in 2010, an increase of $90 million over 2009.
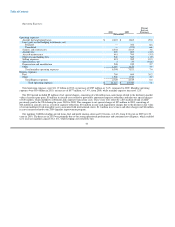
Fuel
The average mainline and Express price per gallon of fuel was $2.25 in 2010 as compared to an average cost per gallon of $1.76 in
2009, an increase of 28.1%. Accordingly, our mainline and Express fuel expense for 2010 was $700 million, or 28.3% higher than the
2009 period on a 0.9% increase in total system capacity.
Since the third quarter of 2008, we have not entered into any new transactions to hedge our fuel consumption, and we have not had any
fuel hedging contracts outstanding since the third quarter of 2009.
Cost Control
We remained committed to maintaining a low cost structure, which we believe is necessary in an industry whose economic prospects
are heavily dependent upon two variables we cannot control: the health of the economy and the price of fuel. Our mainline CASM
excluding special items, fuel and profit sharing, decreased 0.04 cents, or 0.4%, from 8.34 cents in 2009 to 8.30 cents in 2010. The
decrease in the 2010 period was primarily due to our strong operational performance and continued cost diligence, which enabled us to
increase mainline capacity by 1.2% while keeping costs relatively flat.
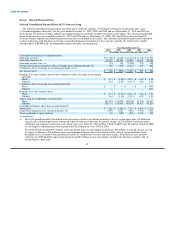
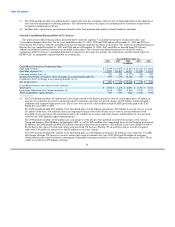
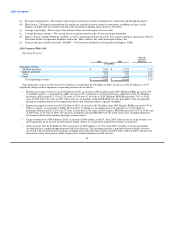
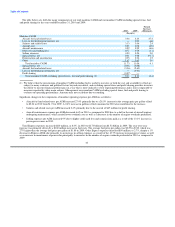
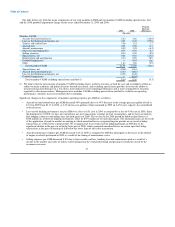
The following table details our mainline costs per available seat mile ("CASM") for the year ended December 31, 2010 and 2009:
Percent
Increase
2010 2009 (Decrease)
(In cents)
Mainline CASM excluding special items, fuel and profit sharing:
Total mainline CASM 11.73 11.06 6.1
Special items, net (0.01) (0.08) (91.7)
Aircraft fuel and related taxes (3.36) (2.63) 27.4
Loss on fuel hedging instruments, net — (0.01) nm
Profit sharing (0.07) — nm
Total mainline CASM excluding special items, fuel and profit sharing (1) 8.30 8.34 (0.4)
(1) We believe that the presentation of mainline CASM excluding fuel is useful to investors as both the cost and availability of fuel are
subject to many economic and political factors beyond our control, and excluding special items and profit sharing provides investors
the ability to measure financial performance in a way that is more indicative of our ongoing performance and is more comparable to
measures reported by other major airlines. Management uses mainline CASM excluding special items, fuel and profit sharing to
evaluate our operating performance. Amounts may not recalculate due to rounding.
Customer Service
In 2010, we continued our trend of strong operational performance. We believe that our focus on excellent customer service in every
aspect of our operations, including personnel, flight equipment, in-flight and ancillary amenities, on-time performance, flight completion
ratios and baggage handling, strengthens customer loyalty and attracts new customers.
37