US Airways 2010 Annual Report Download - page 37
Download and view the complete annual report
Please find page 37 of the 2010 US Airways annual report below. You can navigate through the pages in the report by either clicking on the pages listed below, or by using the keyword search tool below to find specific information within the annual report.-
 1
1 -
2
-
3
-
4
-
5
-
6
-
7
-
8
-
9
-
10
-
11
-
12
-
13
-
14
-
15
-
16
-
17
-
18
-
19
-
20
-
21
-
22
-
23
-
24
-
25
-
26
-
 27
27 -
 28
28 -
 29
29 -
 30
30 -
 31
31 -
 32
32 -
 33
33 -
 34
34 -
 35
35 -
 36
36 -
 37
37 -
 38
38 -
 39
39 -
 40
40 -
 41
41 -
 42
42 -
 43
43 -
 44
44 -
 45
45 -
 46
46 -
 47
47 -
48
-
49
-
50
-
51
-
52
-
53
-
54
-
55
-
56
-
57
-
58
-
59
-
60
-
61
-
62
-
63
-
64
-
65
-
66
-
67
-
68
-
69
-
70
-
71
-
72
-
73
-
74
-
75
-
76
-
77
-
78
-
79
-
80
-
81
-
82
-
83
-
84
-
85
-
86
-
87
-
88
-
89
-
90
-
91
-
92
-
93
-
94
-
95
-
96
-
97
-
98
-
99
-
100
-
101
-
102
-
103
-
104
-
105
-
106
-
107
-
108
-
109
-
110
-
111
-
112
-
113
-
114
-
115
-
116
-
117
-
118
-
119
-
120
-
121
-
122
-
123
-
124
-
125
-
126
-
127
-
128
-
129
-
130
-
131
-
132
-
133
-
134
-
135
-
136
-
137
-
138
-
139
-
140
-
141
-
142
-
143
-
144
-
145
-
146
-
147
-
148
-
149
-
150
-
151
-
152
-
153
-
154
-
155
-
156
-
157
-
158
-
159
-
160
-
161
-
162
-
163
-
164
-
165
-
166
-
167
-
168
-
169
 |
 |

Table of Contents
Item 7. Management's Discussion and Analysis of Financial Condition and Results of Operations
Background
US Airways Group is a holding company whose primary business activity is the operation of a major network air carrier through its
wholly owned subsidiaries US Airways, Piedmont, PSA, MSC and AAL. Effective upon US Airways Group's emergence from
bankruptcy on September 27, 2005, US Airways Group merged with America West Holdings, with US Airways Group as the surviving
corporation.
We operate the fifth largest airline in the United States as measured by domestic RPMs and ASMs. We have hubs in Charlotte,
Philadelphia and Phoenix and a focus city in Washington, D.C. at Ronald Reagan Washington National Airport. We offer scheduled
passenger service on more than 3,200 flights daily to more than 200 communities in the United States, Canada, Mexico, Europe, the
Middle East, the Caribbean, Central and South America. We also have an established East Coast route network, including the US
Airways Shuttle service. We had approximately 52 million passengers boarding our mainline flights in 2010. As of December 31, 2010,
we operated 339 mainline jets and are supported by our regional airline subsidiaries and affiliates operating as US Airways Express under
capacity purchase agreements, which operated 231 regional jets and 50 turboprops. Our prorate carriers operated 10 turboprops and three
regional jets at December 31, 2010.
2010 Year in Review
The U.S. Airline Industry
The U.S. airline industry returned to profitability in 2010 after two difficult and challenging years. Profitability was driven by
increased revenues resulting from improved economic conditions, new ancillary revenues and industry capacity discipline, which enabled
airlines to obtain higher yields. The industry closed out 2010 experiencing continued strong passenger demand. The Air Transport
Association of America reported that December 2010 marked the twelfth consecutive month of year-over-year revenue growth.
International markets outperformed domestic markets with respect to year-over-year improvements in revenue. International markets
had been more severely impacted by the economic slowdown than domestic markets in 2009 due to their greater reliance on business
travel, particularly premium and first class seating, to drive profitability. Cargo demand, which contracted significantly in 2009 due to
reduced business spending, also improved in 2010.
As general economic conditions improved during 2010, market prices for crude oil and related products, including jet fuel, increased
significantly. The average daily spot price of crude oil during 2010 was $79.48 per barrel as compared to $61.95 per barrel in 2009.
Crude oil prices were volatile, with daily spot prices fluctuating between a low of $64.78 per barrel in May 2010 to a high of $91.48 per
barrel in December 2010. Despite these fuel price increases, the airline industry was generally effective in maintaining profitability
during 2010. As the industry enters 2011, a significant uncertainty exists as to whether the economic conditions and industry capacity
discipline that permitted the industry to increase revenues in 2010 and thereby absorb large fuel price increases, will remain in place. See
Part 1, Item 1A, "Risk Factors – Our business is dependent on the price and availability of aircraft fuel. Continued periods of high
volatility in fuel costs, increased fuel prices and significant disruptions in the supply of aircraft fuel could have a significant negative
impact on our operating results and liquidity."
The return of most major domestic carriers to profitability in 2010 improved industry liquidity, which had been significantly strained
by the record fuel price spike in 2008 and recessionary business conditions in late 2008 and 2009. A continuation of these trends is
dependent on, among other things, continued improvement in economic conditions and the ability of the industry to pass through
increased costs, including increased fuel costs.
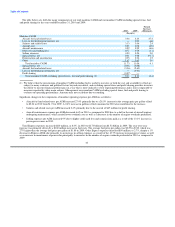
US Airways Group
US Airways Group's net income for the year ended December 31, 2010 was $502 million, or $2.61 per diluted share, which
represented our highest annual profit since our merger in 2005. Additionally, we ran one of the industry's most reliable operations as
measured by the DOT rankings in on-time performance, baggage handling and customer complaints ratio.
36