US Airways 2010 Annual Report Download - page 129
Download and view the complete annual report
Please find page 129 of the 2010 US Airways annual report below. You can navigate through the pages in the report by either clicking on the pages listed below, or by using the keyword search tool below to find specific information within the annual report.-
 1
1 -
2
-
3
-
4
-
5
-
6
-
7
-
8
-
9
-
10
-
11
-
12
-
13
-
14
-
15
-
16
-
17
-
18
-
19
-
20
-
21
-
22
-
23
-
24
-
25
-
26
-
27
-
28
-
29
-
30
-
31
-
32
-
33
-
34
-
35
-
36
-
37
-
38
-
39
-
40
-
41
-
42
-
43
-
44
-
45
-
46
-
47
-
48
-
49
-
50
-
51
-
52
-
53
-
54
-
55
-
56
-
57
-
58
-
59
-
60
-
61
-
62
-
63
-
64
-
65
-
66
-
67
-
68
-
69
-
70
-
71
-
72
-
73
-
74
-
75
-
76
-
77
-
78
-
79
-
80
-
81
-
82
-
83
-
84
-
85
-
86
-
87
-
88
-
89
-
90
-
91
-
92
-
93
-
94
-
95
-
96
-
97
-
98
-
99
-
100
-
101
-
102
-
103
-
104
-
105
-
106
-
107
-
108
-
109
-
110
-
111
-
112
-
113
-
114
-
115
-
116
-
117
-
118
-
 119
119 -
 120
120 -
 121
121 -
 122
122 -
 123
123 -
 124
124 -
 125
125 -
 126
126 -
 127
127 -
 128
128 -
 129
129 -
 130
130 -
 131
131 -
 132
132 -
 133
133 -
 134
134 -
 135
135 -
 136
136 -
 137
137 -
 138
138 -
 139
139 -
140
-
141
-
142
-
143
-
144
-
145
-
146
-
147
-
148
-
149
-
150
-
151
-
152
-
153
-
154
-
155
-
156
-
157
-
158
-
159
-
160
-
161
-
162
-
163
-
164
-
165
-
166
-
167
-
168
-
169
 |
 |

Table of Contents
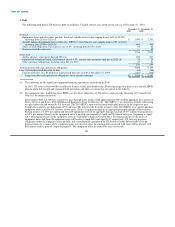
(a) Other Postretirement Benefits Plan
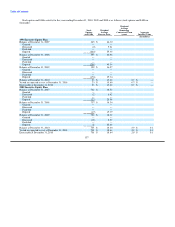
The following table sets forth changes in the fair value of plan assets, benefit obligations and the funded status of the plans and the
amounts recognized in US Airways' consolidated balance sheets as of December 31, 2010 and 2009 (in millions).
Year Ended Year Ended
December 31, December 31,
2010 2009
Fair value of plan assets at beginning of period $ — $ —
Actual return on plan assets — —
Employer contributions 14 19
Plan participants' contributions 16 17
Gross benefits paid (30) (36)
Fair value of plan assets at end of period — —
Benefit obligation at beginning of period 142 121
Service cost 3 2
Interest cost 8 9
Plan participants' contributions 16 17
Actuarial loss 16 11
Gross benefits paid (30) (36)
Plan amendments — 18
Benefit obligation at end of period 155 142
Funded status of the plan (155) (142)
Liability recognized in the consolidated balance sheet $ (155) $ (142)
Net actuarial gain recognized in accumulated other comprehensive income $ 38 $ 59
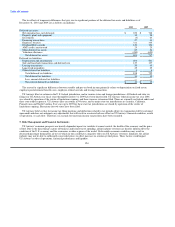
The following table presents the weighted average assumptions used to determine benefit obligations:
Year Ended Year Ended
December 31, December 31,
2010 2009
Discount rate 4.93% 5.51%
US Airways assumed discount rates for measuring its other postretirement benefit obligations, based on a hypothetical portfolio of
high quality corporate bonds denominated in U.S. currency (Aa rated, non-callable or callable with make-whole provisions), for which
the timing and cash outflows approximate the estimated benefit payments of the other postretirement benefit plans.
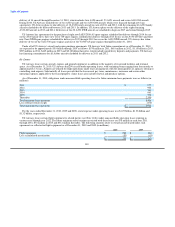
As of December 31, 2010, the assumed health care cost trend rates are 9% in 2011 and 8.5% in 2012, decreasing to 5.0% in 2019 and
thereafter. As of December 31, 2009, the assumed health care cost trend rates are 8% in 2010 and 7.5% in 2011, decreasing to 5.5% in
2015 and thereafter. The assumed health care cost trend rates could have a significant effect on amounts reported for retiree health care
plans. A one-percentage point change in the health care cost trend rates would have the following effects on other postretirement benefits
as of December 31, 2010 (in millions):
1% Increase 1% Decrease
Effect on total service and interest costs $ 1 $ (1)
Effect on postretirement benefit obligation 14 (11)
Weighted average assumptions used to determine net periodic benefit cost were as follows:
Year Ended Year Ended Year Ended
December 31, December 31, December 31,
2010 2009 2008
Discount rate 5.51% 5.98% 5.94%
128