US Airways 2010 Annual Report Download - page 51
Download and view the complete annual report
Please find page 51 of the 2010 US Airways annual report below. You can navigate through the pages in the report by either clicking on the pages listed below, or by using the keyword search tool below to find specific information within the annual report.-
 1
1 -
2
-
3
-
4
-
5
-
6
-
7
-
8
-
9
-
10
-
11
-
12
-
13
-
14
-
15
-
16
-
17
-
18
-
19
-
20
-
21
-
22
-
23
-
24
-
25
-
26
-
27
-
28
-
29
-
30
-
31
-
32
-
33
-
34
-
35
-
36
-
37
-
38
-
39
-
40
-
 41
41 -
 42
42 -
 43
43 -
 44
44 -
 45
45 -
 46
46 -
 47
47 -
 48
48 -
 49
49 -
 50
50 -
 51
51 -
 52
52 -
 53
53 -
 54
54 -
 55
55 -
 56
56 -
 57
57 -
 58
58 -
 59
59 -
 60
60 -
 61
61 -
62
-
63
-
64
-
65
-
66
-
67
-
68
-
69
-
70
-
71
-
72
-
73
-
74
-
75
-
76
-
77
-
78
-
79
-
80
-
81
-
82
-
83
-
84
-
85
-
86
-
87
-
88
-
89
-
90
-
91
-
92
-
93
-
94
-
95
-
96
-
97
-
98
-
99
-
100
-
101
-
102
-
103
-
104
-
105
-
106
-
107
-
108
-
109
-
110
-
111
-
112
-
113
-
114
-
115
-
116
-
117
-
118
-
119
-
120
-
121
-
122
-
123
-
124
-
125
-
126
-
127
-
128
-
129
-
130
-
131
-
132
-
133
-
134
-
135
-
136
-
137
-
138
-
139
-
140
-
141
-
142
-
143
-
144
-
145
-
146
-
147
-
148
-
149
-
150
-
151
-
152
-
153
-
154
-
155
-
156
-
157
-
158
-
159
-
160
-
161
-
162
-
163
-
164
-
165
-
166
-
167
-
168
-
169
 |
 |
Table of Contents
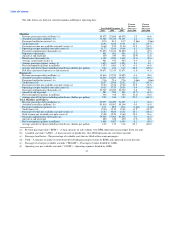
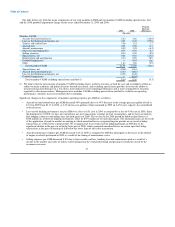
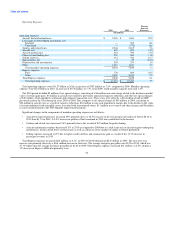
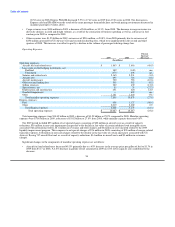
The table below sets forth US Airways' selected mainline and Express operating data:
Percent Percent
Increase Increase
Year Ended December 31, (Decrease) (Decrease)
2010 2009 2008 2010-2009 2009-2008
Mainline
Revenue passenger miles (millions) (a) 58,977 57,889 60,570 1.9 (4.4)
Available seat miles (millions) (b) 71,588 70,725 74,151 1.2 (4.6)
Passenger load factor (percent) (c) 82.4 81.9 81.7 0.5pts 0.2pts
Yield (cents) (d) 12.96 11.66 13.51 11.1 (13.7)
Passenger revenue per available seat mile (cents) (e) 10.68 9.55 11.04 11.9 (13.5)
Aircraft at end of period 339 349 354 (2.9) (1.4)
Fuel consumption (gallons in millions) 1,073 1,069 1,142 0.4 (6.4)
Average aircraft fuel price including related taxes (dollars per gallon) 2.24 1.74 3.17 28.5 (45.0)
Express (f)
Revenue passenger miles (millions) (a) 10,616 10,570 10,855 0.4 (2.6)
Available seat miles (millions) (b) 14,230 14,367 14,953 (1.0) (3.9)
Passenger load factor (percent) (c) 74.6 73.6 72.6 1.0pts 1.0pts
Yield (cents) (d) 26.57 23.68 26.52 12.2 (10.7)
Passenger revenue per available seat mile (cents) (e) 19.83 17.42 19.26 13.8 (9.5)
Aircraft at end of period 281 283 296 (0.7) (4.4)
Fuel consumption (gallons in millions) 336 338 352 (0.6) (3.8)
Average aircraft fuel price including related taxes (dollars per gallon) 2.29 1.80 3.23 27.3 (44.3)
Total Mainline and Express
Revenue passenger miles (millions) (a) 69,593 68,459 71,425 1.7 (4.2)
Available seat miles (millions) (b) 85,818 85,092 89,104 0.9 (4.5)
Passenger load factor (percent) (c) 81.1 80.5 80.2 0.6pts 0.3pts
Yield (cents) (d) 15.04 13.52 15.49 11.2 (12.7)
Passenger revenue per available seat mile (cents) (e) 12.20 10.88 12.42 12.1 (12.4)
Total revenue per available seat mile (cents) (g) 14.05 12.47 13.74 12.7 (9.3)
Aircraft at end of period 620 632 650 (1.9) (2.8)
Fuel consumption (gallons in millions) 1,409 1,407 1,494 0.1 (5.8)
Average aircraft fuel price including related taxes (dollars per gallon) 2.25 1.76 3.18 28.2 (44.8)
(a) Revenue passenger mile ("RPM") – A basic measure of sales volume. One RPM represents one passenger flown one mile.
(b) Available seat mile ("ASM") – A basic measure of production. One ASM represents one seat flown one mile.
(c) Passenger load factor – The percentage of available seats that are filled with revenue passengers.
(d) Yield – A measure of airline revenue derived by dividing passenger revenue by RPMs and expressed in cents per mile.
(e) Passenger revenue per available seat mile ("PRASM") – Passenger revenues divided by ASMs.
(f) Express statistics include Piedmont and PSA, as well as operating and financial results from capacity purchase agreements with Air
Wisconsin Airlines Corporation, Republic Airline Inc., Mesa Airlines, Inc. and Chautauqua Airlines, Inc.
(g) Total revenue per available seat mile ("RASM") – Total revenues divided by total mainline and Express ASMs.
50