US Airways 2010 Annual Report Download - page 138
Download and view the complete annual report
Please find page 138 of the 2010 US Airways annual report below. You can navigate through the pages in the report by either clicking on the pages listed below, or by using the keyword search tool below to find specific information within the annual report.-
 1
1 -
2
-
3
-
4
-
5
-
6
-
7
-
8
-
9
-
10
-
11
-
12
-
13
-
14
-
15
-
16
-
17
-
18
-
19
-
20
-
21
-
22
-
23
-
24
-
25
-
26
-
27
-
28
-
29
-
30
-
31
-
32
-
33
-
34
-
35
-
36
-
37
-
38
-
39
-
40
-
41
-
42
-
43
-
44
-
45
-
46
-
47
-
48
-
49
-
50
-
51
-
52
-
53
-
54
-
55
-
56
-
57
-
58
-
59
-
60
-
61
-
62
-
63
-
64
-
65
-
66
-
67
-
68
-
69
-
70
-
71
-
72
-
73
-
74
-
75
-
76
-
77
-
78
-
79
-
80
-
81
-
82
-
83
-
84
-
85
-
86
-
87
-
88
-
89
-
90
-
91
-
92
-
93
-
94
-
95
-
96
-
97
-
98
-
99
-
100
-
101
-
102
-
103
-
104
-
105
-
106
-
107
-
108
-
109
-
110
-
111
-
112
-
113
-
114
-
115
-
116
-
117
-
118
-
119
-
120
-
121
-
122
-
123
-
124
-
125
-
126
-
127
-
 128
128 -
 129
129 -
 130
130 -
 131
131 -
 132
132 -
 133
133 -
 134
134 -
 135
135 -
 136
136 -
 137
137 -
 138
138 -
 139
139 -
 140
140 -
 141
141 -
 142
142 -
 143
143 -
 144
144 -
 145
145 -
 146
146 -
 147
147 -
 148
148 -
149
-
150
-
151
-
152
-
153
-
154
-
155
-
156
-
157
-
158
-
159
-
160
-
161
-
162
-
163
-
164
-
165
-
166
-
167
-
168
-
169
 |
 |
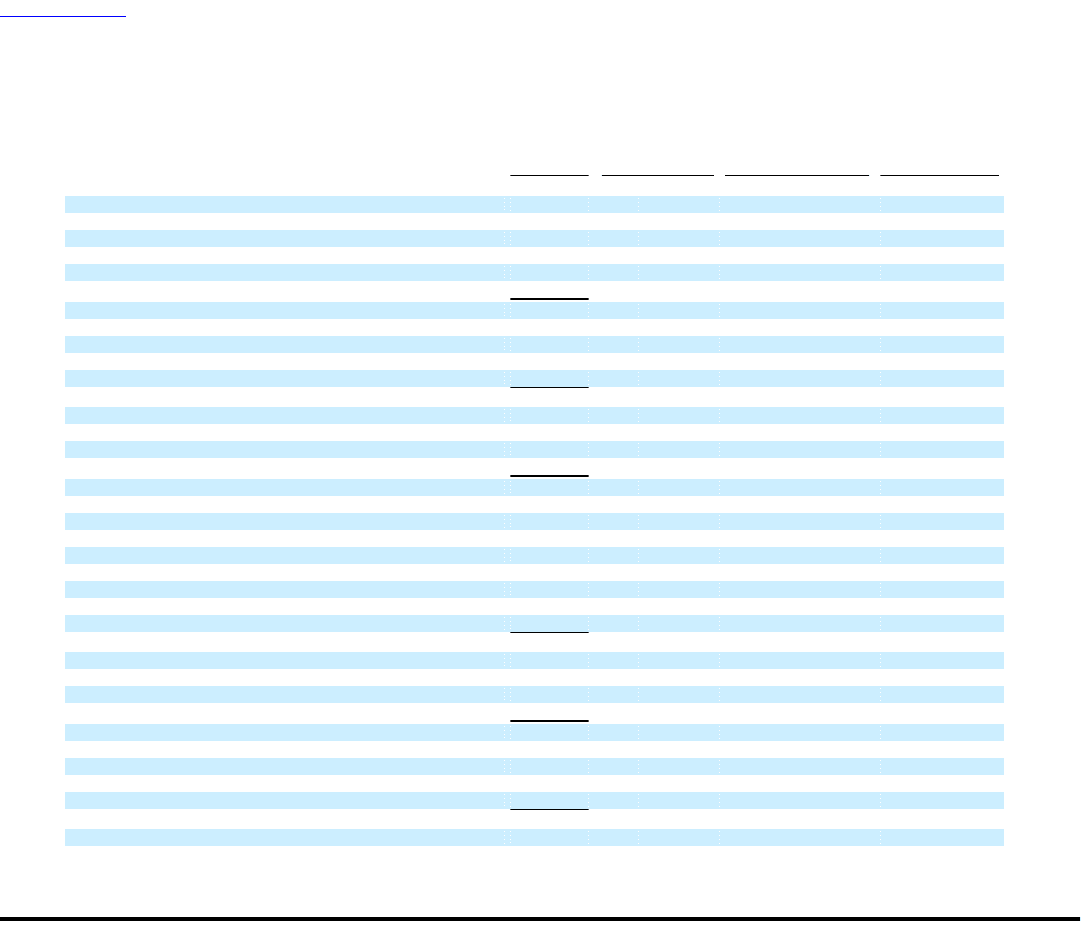
Table of Contents
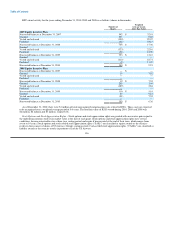
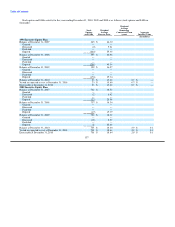
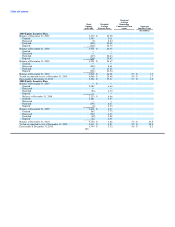
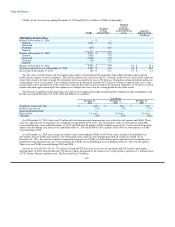
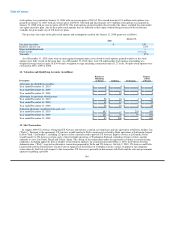
Stock option and SARs activity for the years ending December 31, 2010, 2009 and 2008 is as follows (stock options and SARs in
thousands):
Weighted
Average
Stock Weighted Remaining
Options Average Contractual Term Aggregate
and SARs Exercise Price (years) Intrinsic Value
(In millions)
1994 Incentive Equity Plan
Balance at December 31, 2007 645 $ 46.30
Granted — —
Exercised (2) 9.21
Forfeited — —
Expired (244) 55.35
Balance at December 31, 2008 399 $ 40.96
Granted — —
Exercised — —
Forfeited — —
Expired (200) 45.34
Balance at December 31, 2009 199 $ 36.57
Granted — —
Exercised — —
Forfeited — —
Expired (176) 39.34
Balance at December 31, 2010 23 $ 15.60 0.7 $ —
Vested or expected to vest at December 31, 2010 23 $ 15.60 0.7 $ —
Exercisable at December 31, 2010 23 $ 15.60 0.7 $ —
2002 Incentive Equity Plan
Balance at December 31, 2007 762 $ 18.52
Granted — —
Exercised (2) 6.42
Forfeited — —
Expired (23) 25.08
Balance at December 31, 2008 737 $ 18.34
Granted — —
Exercised — —
Forfeited — —
Expired (17) 19.39
Balance at December 31, 2009 720 $ 18.32
Granted — —
Exercised (18) 5.57
Forfeited — —
Expired (1) 25.60
Balance at December 31, 2010 701 $ 18.64 2.9 $ 0.1
Vested or expected to vest at December 31, 2010 701 $ 18.64 2.9 $ 0.1
Exercisable at December 31, 2010 701 $ 18.64 2.9 $ 0.1
137