US Airways 2010 Annual Report Download - page 45
Download and view the complete annual report
Please find page 45 of the 2010 US Airways annual report below. You can navigate through the pages in the report by either clicking on the pages listed below, or by using the keyword search tool below to find specific information within the annual report.-
 1
1 -
2
-
3
-
4
-
5
-
6
-
7
-
8
-
9
-
10
-
11
-
12
-
13
-
14
-
15
-
16
-
17
-
18
-
19
-
20
-
21
-
22
-
23
-
24
-
25
-
26
-
27
-
28
-
29
-
30
-
31
-
32
-
33
-
34
-
 35
35 -
 36
36 -
 37
37 -
 38
38 -
 39
39 -
 40
40 -
 41
41 -
 42
42 -
 43
43 -
 44
44 -
 45
45 -
 46
46 -
 47
47 -
 48
48 -
 49
49 -
 50
50 -
 51
51 -
 52
52 -
 53
53 -
 54
54 -
 55
55 -
56
-
57
-
58
-
59
-
60
-
61
-
62
-
63
-
64
-
65
-
66
-
67
-
68
-
69
-
70
-
71
-
72
-
73
-
74
-
75
-
76
-
77
-
78
-
79
-
80
-
81
-
82
-
83
-
84
-
85
-
86
-
87
-
88
-
89
-
90
-
91
-
92
-
93
-
94
-
95
-
96
-
97
-
98
-
99
-
100
-
101
-
102
-
103
-
104
-
105
-
106
-
107
-
108
-
109
-
110
-
111
-
112
-
113
-
114
-
115
-
116
-
117
-
118
-
119
-
120
-
121
-
122
-
123
-
124
-
125
-
126
-
127
-
128
-
129
-
130
-
131
-
132
-
133
-
134
-
135
-
136
-
137
-
138
-
139
-
140
-
141
-
142
-
143
-
144
-
145
-
146
-
147
-
148
-
149
-
150
-
151
-
152
-
153
-
154
-
155
-
156
-
157
-
158
-
159
-
160
-
161
-
162
-
163
-
164
-
165
-
166
-
167
-
168
-
169
 |
 |
Table of Contents
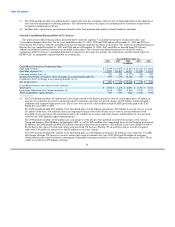
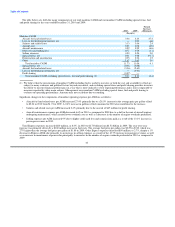
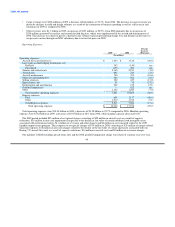
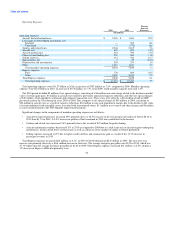
The table below sets forth the major components of our total mainline CASM and our mainline CASM excluding special items, fuel
and profit sharing for the years ended December 31, 2010 and 2009:
Percent
Increase
2010 2009 (Decrease)
(In cents)
Mainline CASM:
Aircraft fuel and related taxes 3.36 2.63 27.4
Loss on fuel hedging instruments, net — 0.01 nm
Salaries and related costs 3.13 3.06 2.4
Aircraft rent 0.93 0.98 (4.9)
Aircraft maintenance 0.92 0.99 (6.6)
Other rent and landing fees 0.77 0.79 (3.1)
Selling expenses 0.59 0.54 9.0
Special items, net 0.01 0.08 (91.7)
Depreciation and amortization 0.35 0.34 1.5
Other 1.67 1.63 2.6
Total mainline CASM 11.73 11.06 6.1
Special items, net (0.01) (0.08)
Aircraft fuel and related taxes (3.36) (2.63)
Loss on fuel hedging instruments, net — (0.01)
Profit sharing (0.07) —
Total mainline CASM excluding special items, fuel and profit sharing (1) 8.30 8.34 (0.4)
(1) We believe that the presentation of mainline CASM excluding fuel is useful to investors as both the cost and availability of fuel are
subject to many economic and political factors beyond our control, and excluding special items and profit sharing provides investors
the ability to measure financial performance in a way that is more indicative of our ongoing performance and is more comparable to
measures reported by other major airlines. Management uses mainline CASM excluding special items, fuel and profit sharing to
evaluate our operating performance. Amounts may not recalculate due to rounding.
Significant changes in the components of mainline operating expense per ASM are as follows:
• Aircraft fuel and related taxes per ASM increased 27.4% primarily due to a 28.5% increase in the average price per gallon of fuel
to $2.24 in 2010 from $1.74 in 2009. A 0.4% increase in gallons of fuel consumed in 2010 also contributed to the increase.
• Salaries and related costs per ASM increased 2.4% primarily due to the accrual of $47 million for profit sharing.
• Aircraft maintenance expense per ASM decreased 6.6% in 2010 as compared to 2009 due to a shift in the mix of aircraft engines
undergoing maintenance, which carried lower overhaul costs as well as a decrease in the number of engine overhauls performed.
• Selling expenses per ASM increased 9% due to higher credit card fees and commissions paid as a result of the 13.1% increase in
passenger revenues in 2010.
Total Express expenses increased $210 million, or 8.4%, in 2010 to $2.73 billion from $2.52 billion in 2009. The year-over-year
increase was primarily driven by a $160 million increase in fuel costs. The average fuel price per gallon was $2.29 in 2010, which was
27% higher than the average fuel price per gallon of $1.80 in 2009. Other Express expenses increased $50 million, or 2.7%, despite a 1%
decrease in Express ASMs due primarily to an increase in selling expenses as a result of the 12.7% increase in passenger revenues as well
as an increase in maintenance expenses due principally to increases in the number of engine overhauls performed in 2010 as compared to
2009.
44