US Airways 2010 Annual Report Download - page 40
Download and view the complete annual report
Please find page 40 of the 2010 US Airways annual report below. You can navigate through the pages in the report by either clicking on the pages listed below, or by using the keyword search tool below to find specific information within the annual report.-
 1
1 -
2
-
3
-
4
-
5
-
6
-
7
-
8
-
9
-
10
-
11
-
12
-
13
-
14
-
15
-
16
-
17
-
18
-
19
-
20
-
21
-
22
-
23
-
24
-
25
-
26
-
27
-
28
-
29
-
 30
30 -
 31
31 -
 32
32 -
 33
33 -
 34
34 -
 35
35 -
 36
36 -
 37
37 -
 38
38 -
 39
39 -
 40
40 -
 41
41 -
 42
42 -
 43
43 -
 44
44 -
 45
45 -
 46
46 -
 47
47 -
 48
48 -
 49
49 -
 50
50 -
51
-
52
-
53
-
54
-
55
-
56
-
57
-
58
-
59
-
60
-
61
-
62
-
63
-
64
-
65
-
66
-
67
-
68
-
69
-
70
-
71
-
72
-
73
-
74
-
75
-
76
-
77
-
78
-
79
-
80
-
81
-
82
-
83
-
84
-
85
-
86
-
87
-
88
-
89
-
90
-
91
-
92
-
93
-
94
-
95
-
96
-
97
-
98
-
99
-
100
-
101
-
102
-
103
-
104
-
105
-
106
-
107
-
108
-
109
-
110
-
111
-
112
-
113
-
114
-
115
-
116
-
117
-
118
-
119
-
120
-
121
-
122
-
123
-
124
-
125
-
126
-
127
-
128
-
129
-
130
-
131
-
132
-
133
-
134
-
135
-
136
-
137
-
138
-
139
-
140
-
141
-
142
-
143
-
144
-
145
-
146
-
147
-
148
-
149
-
150
-
151
-
152
-
153
-
154
-
155
-
156
-
157
-
158
-
159
-
160
-
161
-
162
-
163
-
164
-
165
-
166
-
167
-
168
-
169
 |
 |

Table of Contents
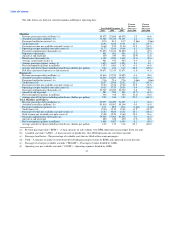
US Airways Group's Results of Operations
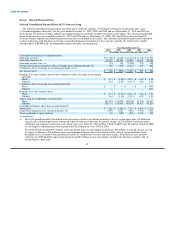
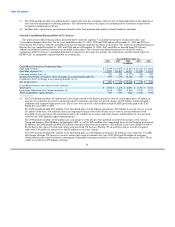
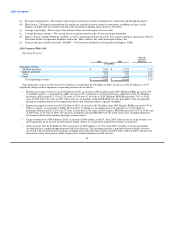
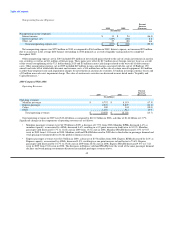
In 2010, we realized operating income of $781 million and income before income taxes of $502 million. We experienced
year-over-year growth in revenues driven by higher yields as a result of the improved economy and industry capacity discipline. Our
2010 results were also impacted by recognition of the following special items:
• $5 million of net special charges, consisting of a $6 million non-cash charge related to the decline in market value of certain spare
parts, $5 million in aircraft costs related to previously announced capacity reductions and other net special charges of $10 million,
which included a settlement and corporate transaction costs. These costs were offset by a $16 million refund of ASIF previously
paid to the TSA during the years 2005 to 2009;
• $1 million refund for our Express subsidiaries of ASIF previously paid to the TSA during the years 2005 to 2009; and
• $53 million of net realized gains related to the sale of certain investments in auction rate securities as well as an $11 million
settlement gain, offset by $5 million in non-cash charges related to the write off of debt issuance costs, all included in
nonoperating expense, net.
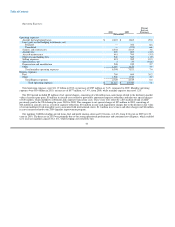
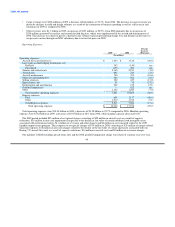
In 2009, we realized operating income of $118 million and a loss before income taxes of $243 million. We experienced significant
declines in revenues in 2009 as a result of the global economic recession. Our 2009 results were also impacted by recognition of the
following special items:
• $375 million of net unrealized gains resulting from the application of mark-to-market accounting for changes in the fair value of
fuel hedging instruments;
• $55 million of net special charges, consisting of $22 million in aircraft costs as a result of capacity reductions, $16 million in non-
cash impairment charges due to the decline in fair value of certain indefinite lived intangible assets associated with international
routes, $11 million in severance and other charges and $6 million in costs incurred related to the 2009 liquidity improvement
program;
• $3 million in non-cash charges related to the decline in market value of certain Express spare parts; and
• $49 million in non-cash charges associated with the sale of 10 Embraer 190 aircraft and write off of related debt discount and
issuance costs, $10 million in other-than-temporary non-cash impairment charges for investments in auction rate securities and a
$2 million non-cash asset impairment charge, all included in nonoperating expense, net.
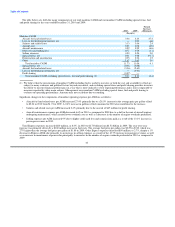
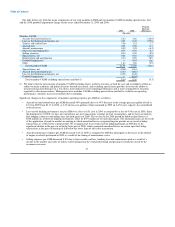
In 2008, we realized an operating loss of $1.8 billion and a loss before income taxes of $2.22 billion. The 2008 loss was driven by an
average mainline and Express price per gallon of fuel of $3.18 as well as a $622 million non-cash charge to write off all of the goodwill
created by the merger of US Airways Group and America West Holdings in September 2005. Our 2008 results were also impacted by
recognition of the following special items:
• $496 million of net unrealized losses resulting from the application of mark-to-market accounting for changes in the fair value of
fuel hedging instruments;
• $76 million of net special charges, consisting of $35 million of merger-related transition expenses, $18 million in non-cash charges
related to the decline in fair value of certain spare parts associated with our Boeing 737 aircraft fleet and, as a result of capacity
reductions, $14 million in aircraft costs and $9 million in severance charges; and
• $214 million in other-than-temporary non-cash impairment charges for investments in auction rate securities as well as $7 million
in write offs of debt discount and debt issuance costs in connection with the refinancing of certain aircraft equipment notes and
certain loan prepayments, offset by $8 million in gains on forgiveness of debt, all included in nonoperating expense, net.
At December 31, 2010, we had approximately $1.92 billion of gross NOLs to reduce future federal taxable income. All of our NOLs
are expected to be available to reduce federal taxable income in the calendar year 2011. The NOLs expire during the years 2024 through
2029. Our net deferred tax assets, which include $1.85 billion of the NOLs, are subject to a full valuation allowance. We also had
approximately $82 million of tax-effected state NOLs
39