Rogers 2007 Annual Report Download - page 92
Download and view the complete annual report
Please find page 92 of the 2007 Rogers annual report below. You can navigate through the pages in the report by either clicking on the pages listed below, or by using the keyword search tool below to find specific information within the annual report.-
 1
1 -
2
-
3
-
4
-
5
-
6
-
7
-
8
-
9
-
10
-
11
-
12
-
13
-
14
-
15
-
16
-
17
-
18
-
19
-
20
-
21
-
22
-
23
-
24
-
25
-
26
-
27
-
28
-
29
-
30
-
31
-
32
-
33
-
34
-
35
-
36
-
37
-
38
-
39
-
40
-
41
-
42
-
43
-
44
-
45
-
46
-
47
-
48
-
49
-
50
-
51
-
52
-
53
-
54
-
55
-
56
-
57
-
58
-
59
-
60
-
61
-
62
-
63
-
64
-
65
-
66
-
67
-
68
-
69
-
70
-
71
-
72
-
73
-
74
-
75
-
76
-
77
-
78
-
79
-
80
-
81
-
 82
82 -
 83
83 -
 84
84 -
 85
85 -
 86
86 -
 87
87 -
 88
88 -
 89
89 -
 90
90 -
 91
91 -
 92
92 -
 93
93 -
 94
94 -
 95
95 -
 96
96 -
 97
97 -
 98
98 -
 99
99 -
 100
100 -
 101
101 -
 102
102 -
103
-
104
-
105
-
106
-
107
-
108
-
109
-
110
-
111
-
112
-
113
-
114
-
115
-
116
-
117
-
118
-
119
-
120
-
121
-
122
-
123
-
124
 |
 |

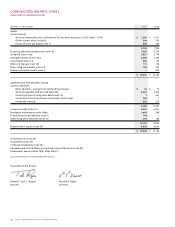
88 ROGERS COMMUNICATIONS INC. 2007 ANNUAL REPORT
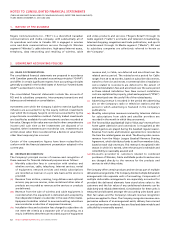
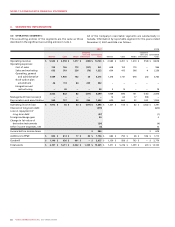
NOTES TO CONSOLIDATED FINANCIAL STATEMENTS
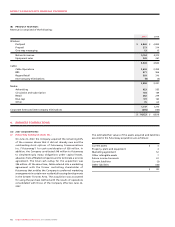
(A) OPERATING SEGMENTS:
The accounting policies of the segments are the same as those
described in the significant accounting policies in note 2.
All of the Company’s reportable segments are substantially in
Canada. Information by reportable segment for the years ended
December 31, 2007 and 2006 is as follows:
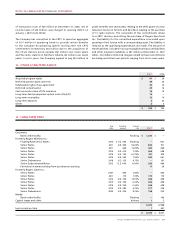
3. SEGMENTED INFORMATION:
2007 2006
Corporate Corporate
items and Consolidated items and Consolidated
Wireless Cable Media eliminations totals Wireless Cable Media eliminations totals
Operating revenue $ 5,503 $ 3,558 $ 1,317 $ (255) $ 10,123 $ 4,580 $ 3,201 $ 1,210 $ (153) $ 8,838
Operating expenses:
Cost of sales 703 186 173 (101) 961 628 153 175 – 956
Sales and marketing 653 519 226 (76) 1,322 604 412 206 4 1,226
Operating, general
and administrative 1,569 1,900 752 30 4,251 1,376 1,731 678 (22) 3,763
Stock option plan
amendment 46 113 84 209 452 – – – – –
Integration and
restructuring – 38 – – 38 3 15 – – 18
2,532 802 82 (317) 3,099 1,969 890 151 (135) 2,875
Management fees (recovery) – – – – – 12 64 17 (93) –
Depreciation and amortization 560 737 52 254 1,603 630 662 52 240 1,584
Operating income (loss) $ 1,972 $ 65 $ 30 $ (571) $ 1,496 $ 1,327 $ 164 $ 82 $ (282) $ 1,291
Interest on long-term debt (579) (620)
Loss on repayment of
long-term debt (47) (1)
Foreign exchange gain 54 2
Change in fair value of
derivative instruments (34) (4)
Other income (expense), net (4) 10
Income before income taxes $ 886 $ 678
Additions to PP&E $ 822 $ 814 $ 77 $ 83 $ 1,796 $ 684 $ 794 $ 48 $ 186 $ 1,712
Goodwill $ 1,140 $ 926 $ 961 $ – $ 3,027 $ 1,150 $ 926 $ 703 $ – $ 2,779
Total assets $ 6,747 $ 5,211 $ 2,042 $ 1,325 $ 15,325 $ 7,471 $ 5,216 $ 1,459 $ (41) $ 14,105