Rogers 2007 Annual Report Download - page 44
Download and view the complete annual report
Please find page 44 of the 2007 Rogers annual report below. You can navigate through the pages in the report by either clicking on the pages listed below, or by using the keyword search tool below to find specific information within the annual report.-
 1
1 -
2
-
3
-
4
-
5
-
6
-
7
-
8
-
9
-
10
-
11
-
12
-
13
-
14
-
15
-
16
-
17
-
18
-
19
-
20
-
21
-
22
-
23
-
24
-
25
-
26
-
27
-
28
-
29
-
30
-
31
-
32
-
33
-
 34
34 -
 35
35 -
 36
36 -
 37
37 -
 38
38 -
 39
39 -
 40
40 -
 41
41 -
 42
42 -
 43
43 -
 44
44 -
 45
45 -
 46
46 -
 47
47 -
 48
48 -
 49
49 -
 50
50 -
 51
51 -
 52
52 -
 53
53 -
 54
54 -
55
-
56
-
57
-
58
-
59
-
60
-
61
-
62
-
63
-
64
-
65
-
66
-
67
-
68
-
69
-
70
-
71
-
72
-
73
-
74
-
75
-
76
-
77
-
78
-
79
-
80
-
81
-
82
-
83
-
84
-
85
-
86
-
87
-
88
-
89
-
90
-
91
-
92
-
93
-
94
-
95
-
96
-
97
-
98
-
99
-
100
-
101
-
102
-
103
-
104
-
105
-
106
-
107
-
108
-
109
-
110
-
111
-
112
-
113
-
114
-
115
-
116
-
117
-
118
-
119
-
120
-
121
-
122
-
123
-
124
 |
 |
40 ROGERS COMMUNICATIONS INC. 2007 ANNUAL REPORT
MANAGEMENT’S DISCUSSION AND ANALYSIS OF FINANCIAL CONDITION AND RESULTS OF OPERATIONS
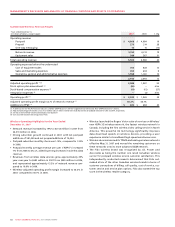
of Call-Net, is generally less capital intensive than its on-net cable
telephony business but also generates lower margins. As a result,
the inclusion of the circuit-switched local telephony business with
Cable Operations’ on-net in-region telephony business has a dilu-
tive impact on operating profit margins.
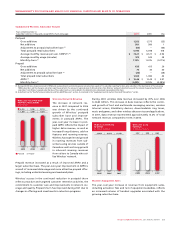
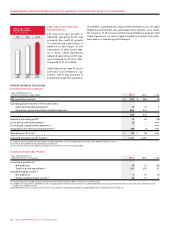
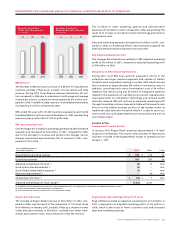
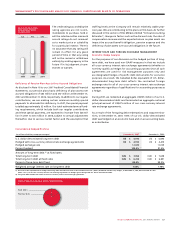
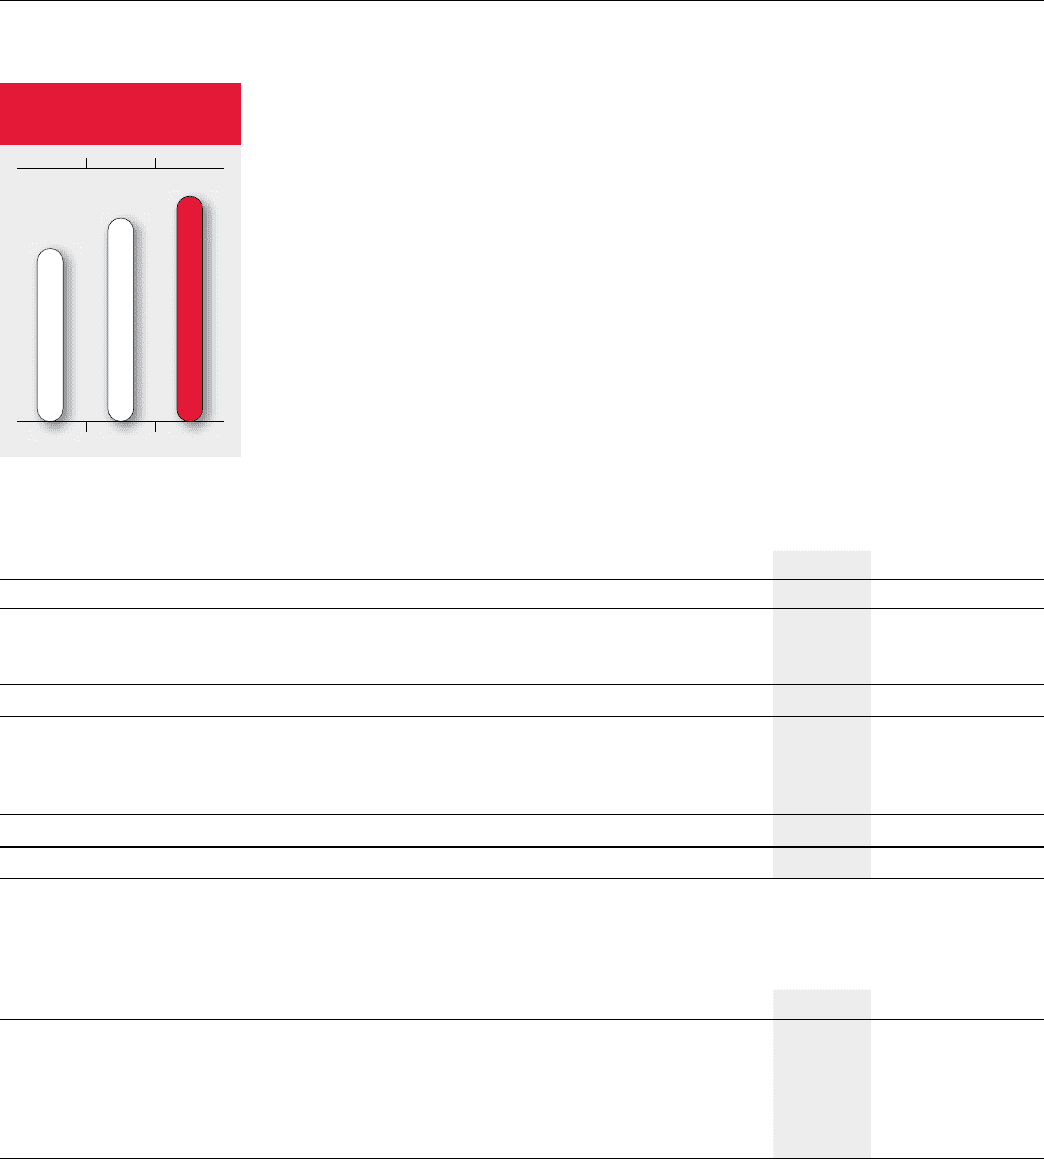
Cable Operations Adjusted
Operating Profit
The year-over-year growth in
adjusted operating profit was
primarily the result of growth
in revenue and subscribers, in
addition to the impact of the
elimination of CRTC Part II fees.
As a result, Cable Operations
adjusted operating profit mar-
gins increased to 38.7% in 2007,
compared to 37.1% in 2006.
Cable Operations’ base of circuit-
switched local telephony cus-
tomers, which was acquired in
July 2005 through the acquisition
20072006
$1,016$916$778
CABLE ADJUSTED
OPERATING PROFIT
(In millions of dollars)
2006
2007
2005
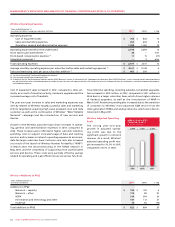
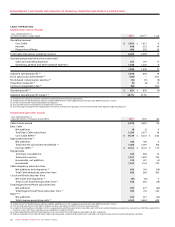
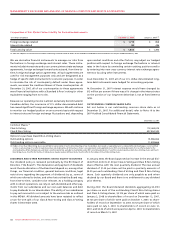
ROGERS BUSINESS SOLUTIONS
Summarized Financial Results
Years ended December 31,
(In millions of dollars, except margin) 2007 2006 % Chg
RBS operating revenue $ 571 $ 596 (4)
Operating expenses before the undernoted
Sales and marketing expenses 75 70 7
Operating, general and administrative expenses 484 477 1
559 547 2
Adjusted operating profit (1) 12 49 (76)
Stock option plan amendment (2) (2) – n/m
Stock-based compensation expense (2) – – n/m
Integration and restructuring expenses (3) (29) (1) n/m
Operating profit (loss) (1) $ (19) $ 48 n/m
Adjusted operating profit margin (1) 2.1% 8.2%
(1) As defined. See the “Key Performance Indicators and Non-GAAP Measures” and “Supplementary Information: Non-GAAP Calculations” sections.
(2) See the section entitled “Stock-based Compensation Expense”.
(3) Costs incurred relate to the integration of the operations of Call-Net and the restructuring of RBS.
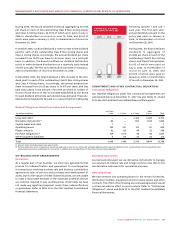
Summarized Subscriber Results
Years ended December 31,
(Subscriber statistics in thousands) 2007 2006 % Chg
Local line equivalents (1)
Net additions 18 33 (15)
Total local line equivalents (2) 237 205 32
Broadband data circuits (3)
Net additions 3 10 (7)
Total broadband data circuits (2) 35 31 4
(1) Local line equivalents include individual voice lines plus Primary Rate Interfaces (“PRIs”) at a factor of 23 voice lines each.
(2) Included in total subscribers at December 31, 2007, are approximately 14,000 local line equivalents and 1,000 broadband data circuits acquired from Futureway in June, 2007. These subscribers are not
included in net additions for 2007.
(3) Broadband data circuits are those customer locations accessed by data networking technologies including DOCSIS, DSL, E10/100/1000, OC 3/12 and DS 1/3.