Rogers 2007 Annual Report Download - page 72
Download and view the complete annual report
Please find page 72 of the 2007 Rogers annual report below. You can navigate through the pages in the report by either clicking on the pages listed below, or by using the keyword search tool below to find specific information within the annual report.-
 1
1 -
2
-
3
-
4
-
5
-
6
-
7
-
8
-
9
-
10
-
11
-
12
-
13
-
14
-
15
-
16
-
17
-
18
-
19
-
20
-
21
-
22
-
23
-
24
-
25
-
26
-
27
-
28
-
29
-
30
-
31
-
32
-
33
-
34
-
35
-
36
-
37
-
38
-
39
-
40
-
41
-
42
-
43
-
44
-
45
-
46
-
47
-
48
-
49
-
50
-
51
-
52
-
53
-
54
-
55
-
56
-
57
-
58
-
59
-
60
-
61
-
 62
62 -
 63
63 -
 64
64 -
 65
65 -
 66
66 -
 67
67 -
 68
68 -
 69
69 -
 70
70 -
 71
71 -
 72
72 -
 73
73 -
 74
74 -
 75
75 -
 76
76 -
 77
77 -
 78
78 -
 79
79 -
 80
80 -
 81
81 -
 82
82 -
83
-
84
-
85
-
86
-
87
-
88
-
89
-
90
-
91
-
92
-
93
-
94
-
95
-
96
-
97
-
98
-
99
-
100
-
101
-
102
-
103
-
104
-
105
-
106
-
107
-
108
-
109
-
110
-
111
-
112
-
113
-
114
-
115
-
116
-
117
-
118
-
119
-
120
-
121
-
122
-
123
-
124
 |
 |
68 ROGERS COMMUNICATIONS INC. 2007 ANNUAL REPORT
MANAGEMENT’S DISCUSSION AND ANALYSIS OF FINANCIAL CONDITION AND RESULTS OF OPERATIONS
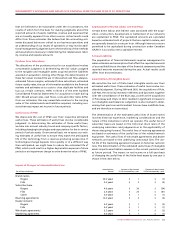
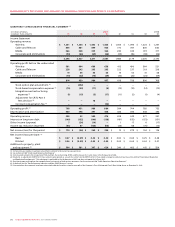
FIVE-YEAR SUMMARY OF CONSOLIDATED FINANCIAL RESULTS
Years ended December 31,
(In millions of dollars, except per share amounts) 2007 2006 2005 2004 2003
Income and Cash Flow:
Revenue
Wireless $ 5,503 $ 4,580 $ 3,860 $ 2,689 $ 2,152
Cable 3,558 3,201 2,492 1,946 1,788
Media 1,317 1,210 1,097 957 855
Corporate and eliminations (255) (153) (115) (78) (59)
$ 10,123 $ 8,838 $ 7,334 $ 5,514 $ 4,736
Operating profit (1)
Wireless $ 2,532 $ 1,969 $ 1,337 $ 950 $ 727
Cable 802 890 765 709 663
Media 82 151 128 115 107
Corporate and eliminations (317) (135) (86) (41) (51)
$ 3,099 $ 2,875 $ 2,144 $ 1,733 $ 1,446
Adjusted operating profit (1)
Wireless $ 2,589 $ 1,987 $ 1,409 $ 958 $ 727
Cable 1,016 916 778 715 663
Media 176 156 131 117 107
Corporate and eliminations (78) (117) (66) (38) (51)
$ 3,703 $ 2,942 $ 2,252 $ 1,752 $ 1,446
Net Income (loss) (2) $ 637 $ 622 $ (45) $ (68) $ 76
Adjusted net income (loss) $ 1,066 $ 684 $ 47 $ (32) $ 92
Cash flow from operations (3) $ 3,135 $ 2,386 $ 1,551 $ 1,305 $ 1,031
Property, plant and equipment expenditures $ 1,796 $ 1,712 $ 1,355 $ 1,055 $ 964
Average Class A and Class B shares outstanding (Ms) (4) 642 642 577 481 452
Net income (loss) per share: (2)(4)
Basic $ 1.00 $ 0.99 $ (0.08) $ (0.14) $ 0.17
Diluted $ 0.99 $ 0.97 $ (0.08) (0.14) 0.16
Adjusted net income (loss) per share:
Basic $ 1.67 $ 1.08 $ 0.08 $ (0.07) $ 0.20
Diluted $ 1.66 1.07 0.08 (0.07) 0.20
Balance Sheet:
Assets
Property, plant and equipment, net $ 7,289 $ 6,732 $ 6,152 $ 5,487 $ 5,039
Goodwill 3,027 2,779 3,036 3,389 1,892
Intangible assets 2,086 2,152 2,627 2,856 400
Investments 485 139 138 139 229
Other assets 2,438 2,303 1,881 1,402 905
$ 15,325 $ 14,105 $ 13,834 $ 13,273 $ 8,465
Liabilities and Shareholders’ Equity
Long-term debt (2) $ 6,033 $ 6,988 $ 7,739 $ 8,542 $ 5,440
Accounts payable and other liabilities 4,668 2,917 2,567 2,346 1,535
Non-controlling interest – – – – 193
Total liabilities 10,701 9,905 10,306 10,888 7,168
Shareholders’ equity 4,624 4,200 3,528 2,385 1,297
$ 15,325 $ 14,105 $ 13,834 $ 13,273 $ 8,465
Ratios:
Revenue growth 15% 21% 33% 16% 12%
Adjusted operating profit growth 26% 31% 29% 21% 26%
Debt (2) /adjusted operating profit 2.1 2.7 3.8 5.3 4.1
Dividends declared per share (4) $ 0.42 $ 0.08 $ 0.06 $ 0.05 $ 0.05
(1) As defined. See “Key Performance Indicators Non-GAAP Measures” section.
(2) Years ended December 31, 2004 and 2003 have been restated for a change in accounting of foreign exchange translation. The ratio of debt to adjusted operating profit includes debt and the foreign
exchange component of the fair value of derivative instruments.
(3) Cash flow from operations before changes in working capital amounts.
(4) Prior period shares and per share amounts have been retroactively adjusted to reflect a two-for-one-split of the Company’s Class A Voting and Class B Non-Voting shares on December 29, 2006.