Rogers 2007 Annual Report Download - page 36
Download and view the complete annual report
Please find page 36 of the 2007 Rogers annual report below. You can navigate through the pages in the report by either clicking on the pages listed below, or by using the keyword search tool below to find specific information within the annual report.-
 1
1 -
2
-
3
-
4
-
5
-
6
-
7
-
8
-
9
-
10
-
11
-
12
-
13
-
14
-
15
-
16
-
17
-
18
-
19
-
20
-
21
-
22
-
23
-
24
-
25
-
 26
26 -
 27
27 -
 28
28 -
 29
29 -
 30
30 -
 31
31 -
 32
32 -
 33
33 -
 34
34 -
 35
35 -
 36
36 -
 37
37 -
 38
38 -
 39
39 -
 40
40 -
 41
41 -
 42
42 -
 43
43 -
 44
44 -
 45
45 -
 46
46 -
47
-
48
-
49
-
50
-
51
-
52
-
53
-
54
-
55
-
56
-
57
-
58
-
59
-
60
-
61
-
62
-
63
-
64
-
65
-
66
-
67
-
68
-
69
-
70
-
71
-
72
-
73
-
74
-
75
-
76
-
77
-
78
-
79
-
80
-
81
-
82
-
83
-
84
-
85
-
86
-
87
-
88
-
89
-
90
-
91
-
92
-
93
-
94
-
95
-
96
-
97
-
98
-
99
-
100
-
101
-
102
-
103
-
104
-
105
-
106
-
107
-
108
-
109
-
110
-
111
-
112
-
113
-
114
-
115
-
116
-
117
-
118
-
119
-
120
-
121
-
122
-
123
-
124
 |
 |
32 ROGERS COMMUNICATIONS INC. 2007 ANNUAL REPORT
MANAGEMENT’S DISCUSSION AND ANALYSIS OF FINANCIAL CONDITION AND RESULTS OF OPERATIONS
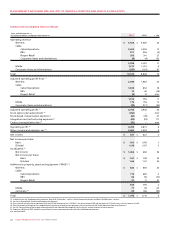
Cost of equipment sales increased in 2007, compared to 2006, pri-
marily as a result of retention activity, hardware upgrades and the
increased average cost of handsets.
The year-over-year increase in sales and marketing expenses was
directly related to Wireless’ largely successful sales and marketing
efforts targeted at acquiring high value postpaid voice and data
customers as well as the continuation of Wireless’ “Most Reliable
Network” campaign and the introduction of new services and
devices.
Growth in the Wireless subscriber base drove increases in operat-
ing, general and administrative expenses in 2007, compared to
2006. These increases were reflected in higher customer retention
spending, costs to support increased usage of data and roaming
services, and increases in network operating expenses to accommo-
date the larger subscriber base. Customer care costs also increased
as a result of the launch of Wireless Number Portability (“WNP”)
in March 2007, the decommissioning of the TDMA network in
May 2007, and the complexity of supporting more sophisticated
services and devices. These costs were partially offset by savings
related to operating and scale efficiencies across various functions.
Total retention spending, including subsidies on handset upgrades,
has increased to $403 million in 2007, compared to $321 million in
2006 due to a larger subscriber base, which drove higher volumes
of handset upgrades, as well as the introduction of WNP in
March 2007. Retention spending also increased due to the transition
of customers to Wireless’ more advanced GSM service from the
older generation TDMA and analog networks, which were decom-
missioned in May 2007.
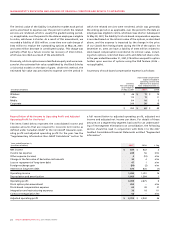
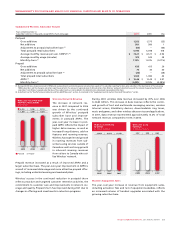
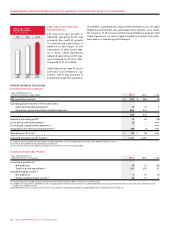
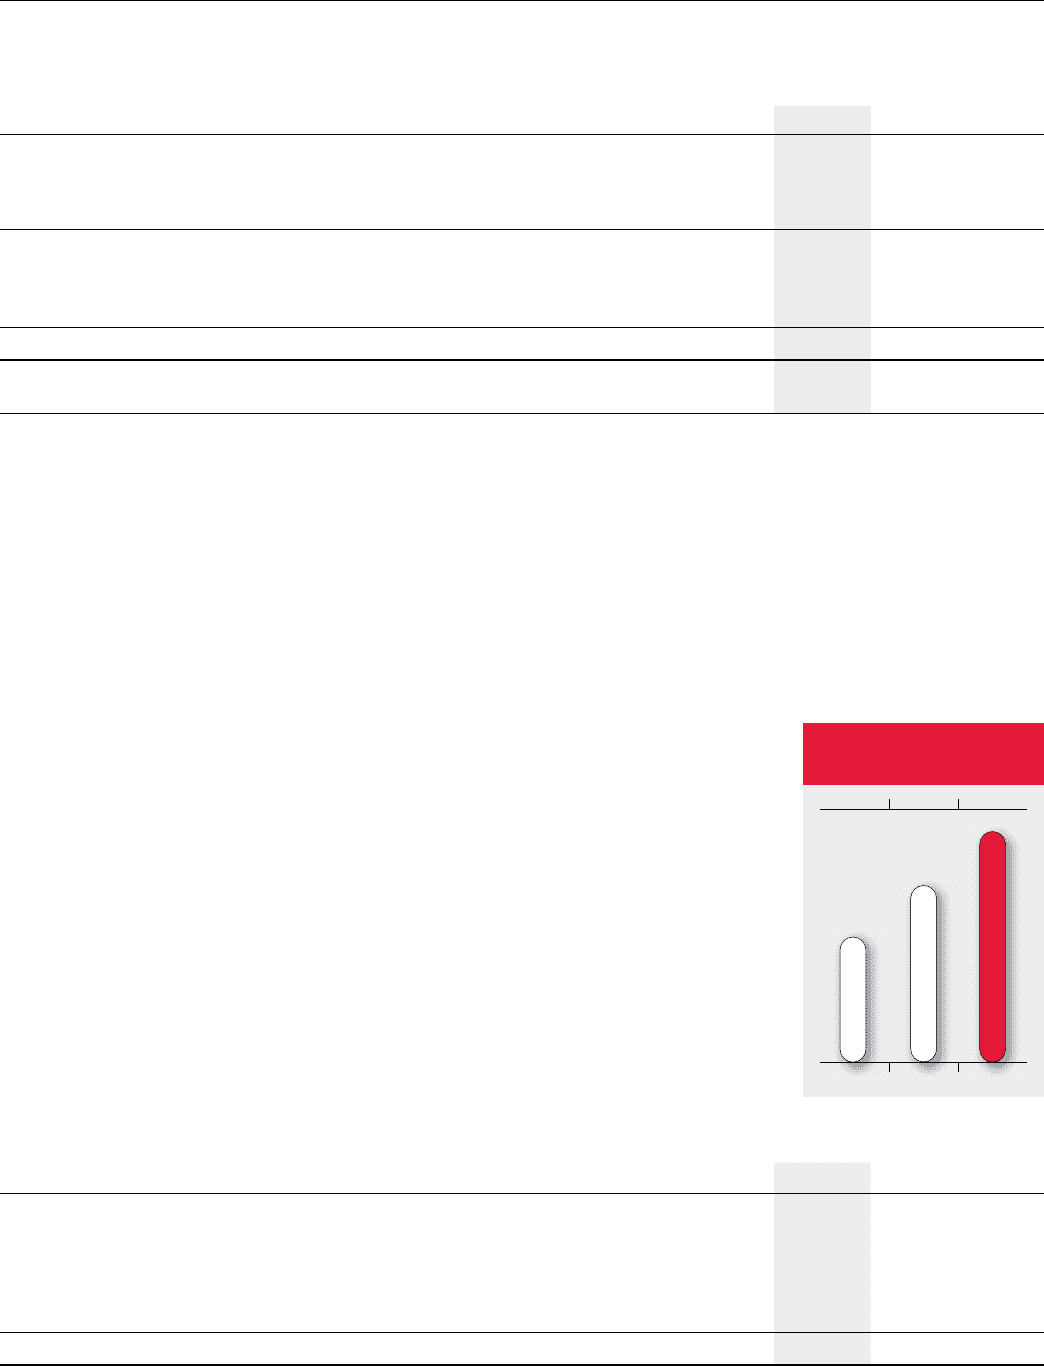
Wireless Adjusted Operating
Profit
The s trong year-over-year
growth in adjusted operat-
ing profit was due to the
significant growth in network
revenue. As a result, Wireless’
adjusted operating profit mar-
gin increased to 50.2% in 2007,
compared to 46.1% in 2006.
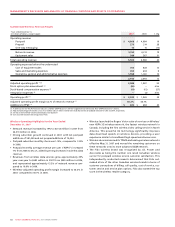
Wireless Operating Expenses
Years ended December 31,
(In millions of dollars, except per subscriber statistics) 2007 2006 % Chg
Operating expenses
Cost of equipment sales $ 703 $ 628 12
Sales and marketing expenses 653 604 8
Operating, general and administrative expenses 1,558 1,361 14
Operating expenses before the undernoted 2,914 2,593 12
Stock option plan amendment (1) 46 – n/m
Stock-based compensation expense (1) 11 15 (27)
Integration expenses (2) – 3 n/m
Total operating expenses $ 2,971 $ 2,611 14
Average monthly operating expense per subscriber before sales and marketing expenses (3) $ 20.61 $ 19.48 6
Sales and marketing costs per gross subscriber addition (3) $ 401 $ 399 1
(1) See the section entitled “Stock-based Compensation Expense”.
(2) Costs incurred related to the integration of Fido.
(3) As defined. See the “Key Performance Indicator and Non-GAAP Measures” section. As calculated in the “Supplementary Information: Non-GAAP Calculations” section. Average monthly operating expense
per subscriber before sales and marketing expenses excludes the one-time non-cash expense related to the introduction of a cash settlement feature for stock options, stock-based compensation expense
and integration expenses.
20072006
$2,589$1,987$1,409
WIRELESS ADJUSTED
OPERATING PROFIT
(In millions of dollars)
2006
2007
2005
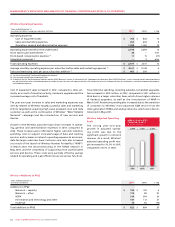
Wireless Additions to PP&E
Years ended December 31,
(In millions of dollars) 2007 2006 % Chg
Additions to PP&E
Network – capacity $ 169 $ 159 6
Network – other 175 89 97
HSPA 316 264 20
Information and technology and other 147 112 31
Inukshuk 15 60 (75)
Total additions to PP&E $ 822 $ 684 20