Rogers 2007 Annual Report Download - page 2
Download and view the complete annual report
Please find page 2 of the 2007 Rogers annual report below. You can navigate through the pages in the report by either clicking on the pages listed below, or by using the keyword search tool below to find specific information within the annual report.-
 1
1 -
 2
2 -
 3
3 -
 4
4 -
 5
5 -
 6
6 -
 7
7 -
 8
8 -
 9
9 -
 10
10 -
 11
11 -
 12
12 -
 13
13 -
14
-
15
-
16
-
17
-
18
-
19
-
20
-
21
-
22
-
23
-
24
-
25
-
26
-
27
-
28
-
29
-
30
-
31
-
32
-
33
-
34
-
35
-
36
-
37
-
38
-
39
-
40
-
41
-
42
-
43
-
44
-
45
-
46
-
47
-
48
-
49
-
50
-
51
-
52
-
53
-
54
-
55
-
56
-
57
-
58
-
59
-
60
-
61
-
62
-
63
-
64
-
65
-
66
-
67
-
68
-
69
-
70
-
71
-
72
-
73
-
74
-
75
-
76
-
77
-
78
-
79
-
80
-
81
-
82
-
83
-
84
-
85
-
86
-
87
-
88
-
89
-
90
-
91
-
92
-
93
-
94
-
95
-
96
-
97
-
98
-
99
-
100
-
101
-
102
-
103
-
104
-
105
-
106
-
107
-
108
-
109
-
110
-
111
-
112
-
113
-
114
-
115
-
116
-
117
-
118
-
119
-
120
-
121
-
122
-
123
-
124
 |
 |

ROGERS COMMUNICATIONS INC. AT A GLANCE
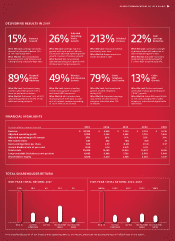
DELIVERING RESULTS IN 2007
What We Said: Leverage networks,
channels and brand to deliver 10%
to 13% revenue growth.
What We Did: 15% consolidated
revenue growth with Wireless and
Cable growing at double-digit rates.
What We Said: Leverage top-line
growth with scale and cost efficien-
cies to drive adjusted operating profit
growth in excess of revenue growth.
What We Did: 26% consolidated
adjusted operating profit growth with
330 basis point margin expansion.
What We Said: Increase dividends
consistently over time.
What We Did: Rogers more than
triples dividend in 2007.
What We Said: Continue to strength-
en balance sheet with reduction in
debt to operating profit ratio.
What We Did: Achieved investment
grade ratings and deleveraged to
2.1 times debt to operating profit.
What We Said: Continued strong
wireless subscriber growth with a
focus on postpaid customers.
What We Did: Delivered 118% of 2007
subscriber guidance with 89% of net
additions being postpaid.
What We Said: Industry-leading
wireless data growth to support
continued ARPU expansion.
What We Did: 49% wireless data
revenue growth with data as a per-
cent of network revenue expanding
to 13.2% from 10.6% in 2006.
What We Said: Continued rapid
growth of cable telephony
during 2007.
What We Did: Expanded coverage
area to 94% of cable territory
and grew subscriber base 79%
to 655,800.
What We Said: Deliver continued
solid cable revenue generating unit
(“RGU”) growth.
What We Did: Cable RGUs up 654,800
or 13% with solid growth in cable
telephony, Internet and digital cable
subscribers.
15% 22%
Revenue
Growth
Debt
Leverage
Reduction
FINANCIAL HIGHLIGHTS
(In millions of dollars, except per share data) 2007 2006 2005 2004 2003
Revenue $ 10,123 $ 8,838 $ 7,334 $ 5,514 $ 4,736
Adjusted operating profit 3,703 2,942 2,252 1,752 1,446
Adjusted operating profit margin 37% 33% 31% 32% 31%
Net income (loss) 637 622 (45) (68) 76
Basic earnings (loss) per share 1.00 0.99 (0.08) (0.14) 0.17
Annual dividend rate at year-end 0.50 0.16 0.075 0.05 –
Total assets 15,325 14,105 13,834 13,273 8,465
Long-term debt (includes current portion) 6,033 6,988 7,739 8,542 5,440
Shareholders‘ equity 4,624 4,200 3,528 2,385 1,297
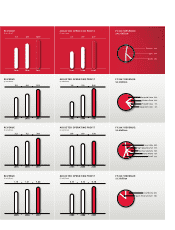
TOTAL SHAREHOLDER RETURN
ONE-YEAR TOTAL RETURN: 2007 FIVE-YEAR TOTAL RETURN: 2003–2007
S&P 500S&P/TSX
COMPOSITE
RCI.B.TO
6%10%31%
S&P 500S&P/TSX
COMPOSITE
RCI.B.TO
83%132%529%
TSX TELECOM
INDEX
N.A. TELECOM
INDEX
17%
TSX TELECOM
INDEX
N.A. TELECOM
INDEX
151%
5% 120%
For a detailed discussion of our financial and operating metrics, and results, please see the accompanying 2007 MD&A later in this report.
26% Adjusted
Operating
Profit
Growth
89%Postpaid
Wireless
Additions 49%Wireless
Data Revenue
Growth
213% Dividend
Increase
13% Cable
RGU
Growth
79% Cable
Telephony
Sub Growth