Rogers 2007 Annual Report Download - page 29
Download and view the complete annual report
Please find page 29 of the 2007 Rogers annual report below. You can navigate through the pages in the report by either clicking on the pages listed below, or by using the keyword search tool below to find specific information within the annual report.-
 1
1 -
2
-
3
-
4
-
5
-
6
-
7
-
8
-
9
-
10
-
11
-
12
-
13
-
14
-
15
-
16
-
17
-
18
-
 19
19 -
 20
20 -
 21
21 -
 22
22 -
 23
23 -
 24
24 -
 25
25 -
 26
26 -
 27
27 -
 28
28 -
 29
29 -
 30
30 -
 31
31 -
 32
32 -
 33
33 -
 34
34 -
 35
35 -
 36
36 -
 37
37 -
 38
38 -
 39
39 -
40
-
41
-
42
-
43
-
44
-
45
-
46
-
47
-
48
-
49
-
50
-
51
-
52
-
53
-
54
-
55
-
56
-
57
-
58
-
59
-
60
-
61
-
62
-
63
-
64
-
65
-
66
-
67
-
68
-
69
-
70
-
71
-
72
-
73
-
74
-
75
-
76
-
77
-
78
-
79
-
80
-
81
-
82
-
83
-
84
-
85
-
86
-
87
-
88
-
89
-
90
-
91
-
92
-
93
-
94
-
95
-
96
-
97
-
98
-
99
-
100
-
101
-
102
-
103
-
104
-
105
-
106
-
107
-
108
-
109
-
110
-
111
-
112
-
113
-
114
-
115
-
116
-
117
-
118
-
119
-
120
-
121
-
122
-
123
-
124
 |
 |
ROGERS COMMUNICATIONS INC. 2007 ANNUAL REPORT 25
MANAGEMENT’S DISCUSSION AND ANALYSIS OF FINANCIAL CONDITION AND RESULTS OF OPERATIONS
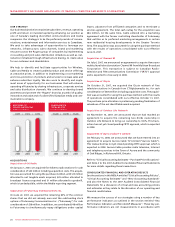
Net Income and Net Income per Share
We recorded net income of
$637 million in 2007, or basic
net income per share of $1.00
(diluted – $0.99), compared to
net income of $622 million, or
basic net income per share of
$0.99 (diluted – $0.97) for the
year ended December 31, 2006.
This increase in net income was
primarily due to the growth in
operating income, as well as the
decrease in interest on long-term
debt, offset by the one-time
non-cash charge related to the
introduction of a cash settle-
ment feature for employee stock
options of $452 million.
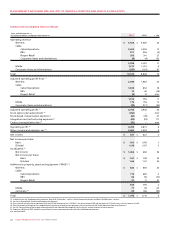
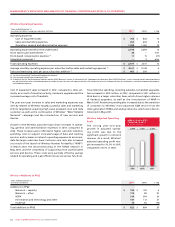
Income Tax Expense
Due to our non-capital loss carryforwards, our income tax expense
for the years ended December 31, 2007 and 2006 substantially rep-
resents non-cash income taxes. As illustrated in the table below,
our effective income tax rate for the years ended December 31,
2007 and 2006 was 28.1% and 8.3%, respectively. The effective
income tax rate for the year ended December 31, 2007 was less than
the 2007 statutory income tax rate of 35.2% primarily due to ben-
efits realized from changes to prior year income tax filing positions
as well as a $25 million future income tax recovery recorded with
respect to the Vidéotron termination payment to reverse a charge
recorded by us in 2006 (see Note 7 of our 2007 Audited Consolidated
Financial Statements). In addition, we recorded a future income tax
recovery associated with the reclassification of contributed surplus
upon the introduction of a cash settlement feature for employee
stock options (see the section entitled “Stock-based Compensation
Expense”). The 2006 effective income tax rate was less than the
2006 statutory rate of 35.8% due primarily to a decrease in the valu-
ation allowance recorded in respect of non-capital losses.
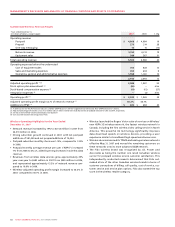
Income tax expense varies from the amounts that would be com-
puted by applying the statutory income tax rate to income before
income taxes for the following reasons:
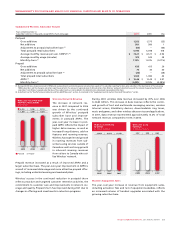
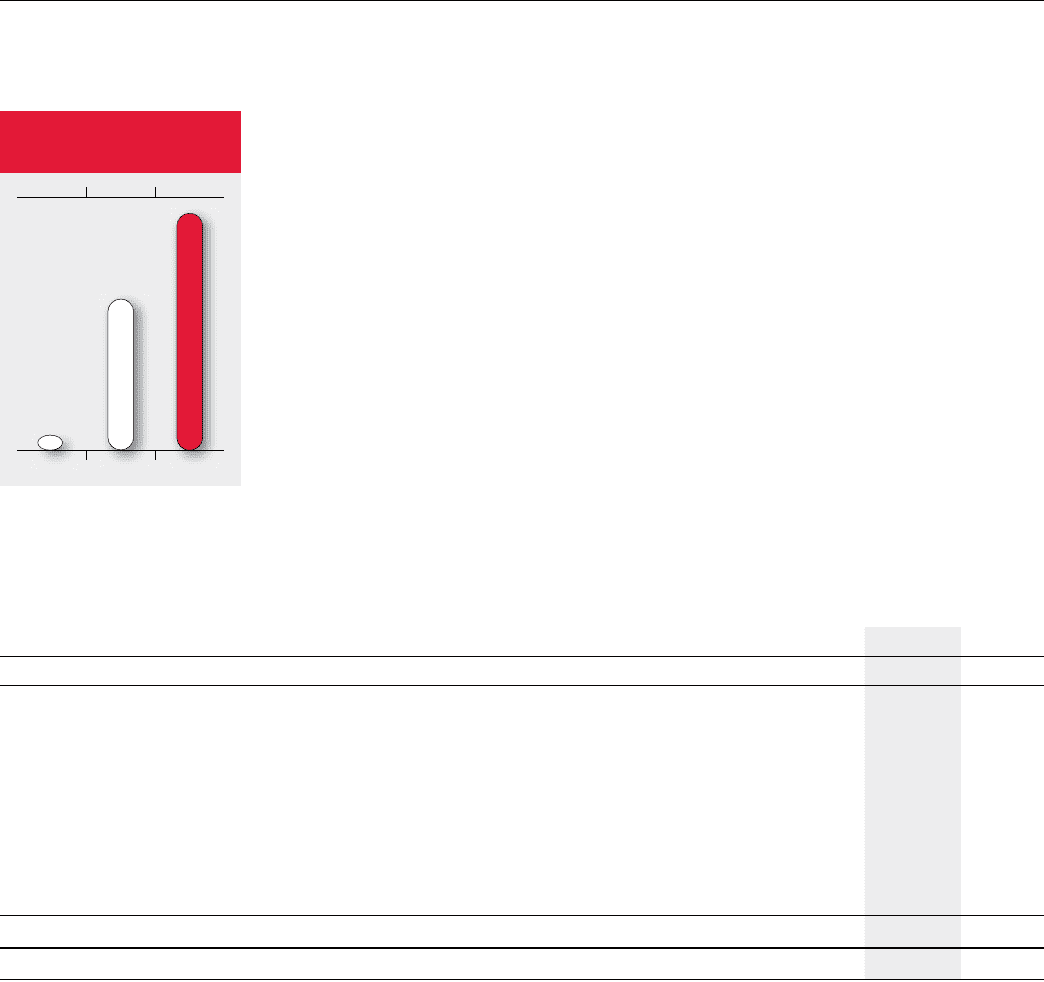
20072006
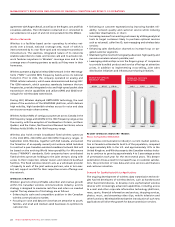
$1,066$684$47
CONSOLIDATED ADJUSTED
NET INCOME
(In millions of dollars)
2006
2007
2005
Years ended December 31,
(In millions of dollars) 2007 2006
Statutory income tax rate 35.2% 35.8%
Income before income taxes $ 886 $ 678
Computed income tax expense $ 312 $ 243
Increase (decrease) in income taxes resulting from:
Difference between rates applicable to subsidiaries in other jurisdictions (12) (12)
Change in the valuation allowance for future income tax assets (20) (168)
Videotron termination payment (25) 25
Adjustments to future income tax assets and liabilities for changes in
substantively enacted income tax rates 47 (14)
Stock-based compensation (17) 15
Benefits realized from changes to prior year income tax filing positions and other adjustments (36) (33)
Income tax expense $ 249 $ 56
Effective income tax rate 28.1% 8.3%
Other Expense (Income)
In 2007, investment income received from certain of our invest-
ments was offset by a writedown to reflect what was deemed to be
an “other than temporary decline” in the value of an investment,
and certain other writedowns, resulting in a net expense of $4 mil-
lion. Other income of $10 million in 2006 was primarily associated
with investment income received from certain of our investments.
Change in Fair Value of Derivative Instruments
In 2007, the change in fair value of the derivative instruments was
primarily the result of the changes in fair value of cross-currency
interest rate exchange agreements and forward contracts not
accounted for as hedges. In 2006, the changes in fair value of the
derivative instruments were primarily the result of the changes in
the Canadian dollar relative to that of the U.S. dollar, as described
below, and the resulting change in fair value of our cross-currency
interest rate exchange agreements not accounted for as hedges.
Loss on Repayment of Long-Term Debt
During 2007, we redeemed Wireless’ US$155 million 9.75% Senior
Debentures due 2016 and Wireless’ US$550 million Floating Rate
Senior Notes due 2010. These redemptions resulted in a loss on
repayment of long-term debt of $47 million, including aggregate
redemption premiums of $59 million offset by a write-off of the fair
value increment arising from purchase accounting of $12 million.
During 2006, we redeemed $25 million (US$22 million) of RCI’s (via
Rogers Telecom Holdings Inc., formerly Call-Net) 10.625% Senior
Secured Notes due 2008, resulting in a loss on repayment of long-
term debt of $1 million.