Rogers 2007 Annual Report Download - page 35
Download and view the complete annual report
Please find page 35 of the 2007 Rogers annual report below. You can navigate through the pages in the report by either clicking on the pages listed below, or by using the keyword search tool below to find specific information within the annual report.-
 1
1 -
2
-
3
-
4
-
5
-
6
-
7
-
8
-
9
-
10
-
11
-
12
-
13
-
14
-
15
-
16
-
17
-
18
-
19
-
20
-
21
-
22
-
23
-
24
-
 25
25 -
 26
26 -
 27
27 -
 28
28 -
 29
29 -
 30
30 -
 31
31 -
 32
32 -
 33
33 -
 34
34 -
 35
35 -
 36
36 -
 37
37 -
 38
38 -
 39
39 -
 40
40 -
 41
41 -
 42
42 -
 43
43 -
 44
44 -
 45
45 -
46
-
47
-
48
-
49
-
50
-
51
-
52
-
53
-
54
-
55
-
56
-
57
-
58
-
59
-
60
-
61
-
62
-
63
-
64
-
65
-
66
-
67
-
68
-
69
-
70
-
71
-
72
-
73
-
74
-
75
-
76
-
77
-
78
-
79
-
80
-
81
-
82
-
83
-
84
-
85
-
86
-
87
-
88
-
89
-
90
-
91
-
92
-
93
-
94
-
95
-
96
-
97
-
98
-
99
-
100
-
101
-
102
-
103
-
104
-
105
-
106
-
107
-
108
-
109
-
110
-
111
-
112
-
113
-
114
-
115
-
116
-
117
-
118
-
119
-
120
-
121
-
122
-
123
-
124
 |
 |

ROGERS COMMUNICATIONS INC. 2007 ANNUAL REPORT 31
MANAGEMENT’S DISCUSSION AND ANALYSIS OF FINANCIAL CONDITION AND RESULTS OF OPERATIONS
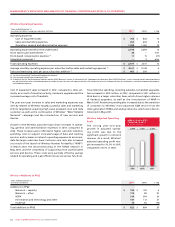
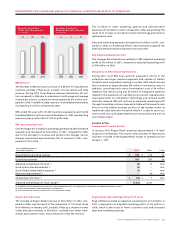
During 2007, wireless data revenue increased by 49% over 2006
to $683 million. This increase in data revenue reflects the contin-
ued growth of text and multimedia messaging services, wireless
Internet access, BlackBerry devices, downloadable ring tones,
music and games, and other wireless data services and applications.
In 2007, data revenue represented approximately 13.2% of total
network revenue, compared to 10.6% in 2006.
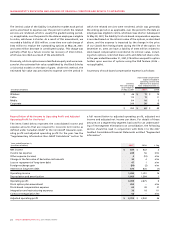
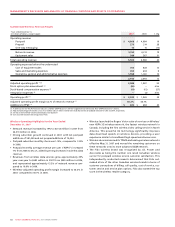
Wireless Equipment Sales
The year-over-year increase in revenue from equipment sales,
including activation fees and net of equipment subsidies, reflects
an increased volume of handset upgrades associated with the
growing subscriber base.
Wireless Network Revenue
The increase in network rev-
enue in 2007 compared to 2006
was driven by the continued
growth of Wireless’ postpaid
subscriber base and improve-
ments in postpaid ARPU. The
year-over-year increase in post-
paid ARPU reflects the impact of
higher data revenue, as well as
increased long-distance, add-on
features and roaming revenue.
Wireless has experienced growth
in roaming revenues from sub-
scribers using services outside of
Canada as well as strong growth
in inbound roaming revenues
from visitors to Canada who uti-
lize Wireless’ network.
Prepaid revenue increased as a result of improved ARPU and a
larger subscriber base. The year-over-year improvement in ARPU is
a result of increased data usage and more attractive prepaid offer-
ings, including unlimited evening and weekend plans.
Wireless’ success in the continued reduction in postpaid churn
reflects proactive and targeted customer retention activities, the
commitment to customer care and improvements in network cov-
erage and quality. Prepaid churn has improved during 2007 due to
changes in offerings and investments in retention programs.
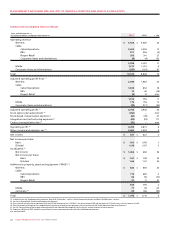
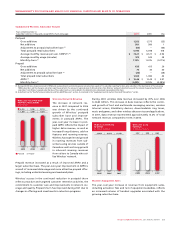
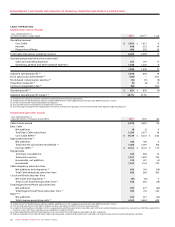
Summarized Wireless Subscriber Results
Years ended December 31,
(Subscriber statistics in thousands, except ARPU, churn and usage) 2007 2006 Chg
Postpaid
Gross additions 1,352 1,375 (23)
Net additions 581 580 1
Adjustment to postpaid subscriber base (1) (65) – (65)
Total postpaid retail subscribers 5,914 5,398 516
Average monthly revenue per user (“ARPU”) (2) $ 72.21 $ 67.27 $ 4.94
Average monthly usage (minutes) 573 545 28
Monthly churn (1) 1.15% 1.32% (0.17%)
Prepaid
Gross additions 635 615 20
Net additions 70 30 40
Adjustment to prepaid subscriber base (1) (26) – (26)
Total prepaid retail subscribers 1,424 1,380 44
ARPU (2) $ 16.46 $ 13.49 $ 2.97
Monthly churn (1) 3.42% 3.70% (0.28%)
(1) During 2007, Wireless decommissioned its TDMA and analog networks and simultaneously revised certain aspects of its subscriber reporting for data-only subscribers. The deactivation of the remaining
TDMA subscribers and the change in subscriber reporting resulted in the removal of approximately 65,000 subscribers from Wireless’ postpaid subscriber base and the removal of approximately 26,000
subscribers from Wireless’ prepaid subscriber base. These adjustments are not included in the determination of postpaid or prepaid monthly churn.
(2) As defined. See the “Key Performance Indicators and Non-GAAP Measures” section. As calculated in the “Supplementary Information: Non-GAAP Calculations” section.
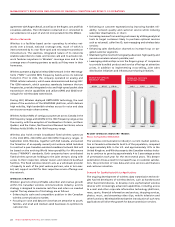
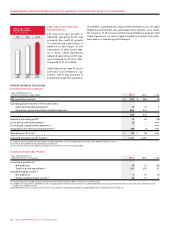
200720062005
5,9145,3984,818
1,4241,3801,350
Postpaid Prepaid
WIRELESS POSTPAID AND
PREPAID SUBSCRIBERS
(In thousands)
20072006
$5,154$4,313$3,614
WIRELESS NETWORK
REVENUE
(In millions of dollars)
2006
2007
2005
20072006
$683$459$297
WIRELESS DATA
REVENUE
(In millions of dollars)
200
6
2007
2005