Rogers 2007 Annual Report Download - page 30
Download and view the complete annual report
Please find page 30 of the 2007 Rogers annual report below. You can navigate through the pages in the report by either clicking on the pages listed below, or by using the keyword search tool below to find specific information within the annual report.-
 1
1 -
2
-
3
-
4
-
5
-
6
-
7
-
8
-
9
-
10
-
11
-
12
-
13
-
14
-
15
-
16
-
17
-
18
-
19
-
 20
20 -
 21
21 -
 22
22 -
 23
23 -
 24
24 -
 25
25 -
 26
26 -
 27
27 -
 28
28 -
 29
29 -
 30
30 -
 31
31 -
 32
32 -
 33
33 -
 34
34 -
 35
35 -
 36
36 -
 37
37 -
 38
38 -
 39
39 -
 40
40 -
41
-
42
-
43
-
44
-
45
-
46
-
47
-
48
-
49
-
50
-
51
-
52
-
53
-
54
-
55
-
56
-
57
-
58
-
59
-
60
-
61
-
62
-
63
-
64
-
65
-
66
-
67
-
68
-
69
-
70
-
71
-
72
-
73
-
74
-
75
-
76
-
77
-
78
-
79
-
80
-
81
-
82
-
83
-
84
-
85
-
86
-
87
-
88
-
89
-
90
-
91
-
92
-
93
-
94
-
95
-
96
-
97
-
98
-
99
-
100
-
101
-
102
-
103
-
104
-
105
-
106
-
107
-
108
-
109
-
110
-
111
-
112
-
113
-
114
-
115
-
116
-
117
-
118
-
119
-
120
-
121
-
122
-
123
-
124
 |
 |

26 ROGERS COMMUNICATIONS INC. 2007 ANNUAL REPORT
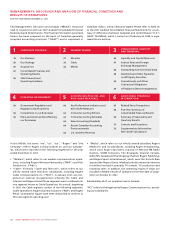
MANAGEMENT’S DISCUSSION AND ANALYSIS OF FINANCIAL CONDITION AND RESULTS OF OPERATIONS
Foreign Exchange Gain
During 2007, the Canadian dollar strengthened by 17.72 cents result-
ing in a foreign exchange gain of $54 million from the translation
of the portion of our U.S. dollar-denominated debt that was
unhedged for accounting purposes. During 2006, the foreign
exchange gain of $2 million arose primarily from the strengthening
of the Canadian dollar during 2006 from $1.1659 at December 31,
2005 to $1.1653 at December 31, 2006, favourably affecting the trans-
lation of the unhedged portion of our U.S. dollar-denominated
debt.
Interest on Long-Term Debt
The decrease in interest expense from 2006 is primarily due to the
repayment of long-term debt in 2007, including the impact of the
settlement of certain of our cross-currency interest rate exchange
agreements.
The decrease in debt was largely the result of the February 2007
repayment at maturity of Cable’s $450 million 7.60% Senior Notes
due 2007, the May 2007 redemption of Wireless’ US$550 million
Floating Rate Senior Notes due 2010 and the June 2007 redemp-
tion of Wireless’ US$155 million 9.75% Senior Debentures due
2016. These repayments were partially offset by the $1,080 million
net increase in bank debt at December 31, 2007, compared to
December 31, 2006.
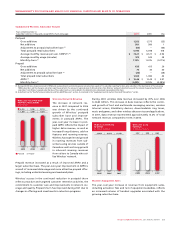
Operating Income
The 16% increase in our operating income is primarily due to the
growth in revenue of $1,285 million exceeding the growth in oper-
ating expenses of $1,061 million, and the increase in depreciation
and amortization expense of $19 million compared to 2006.
Depreciation and Amortization Expense
The increase in depreciation and amortization expense for the year
ended December 31, 2007, over 2006 reflects an increase in depreci-
ation and amortization related to PP&E. This was partially offset by
a decrease in amortization of intangible assets resulting from the
reduction in the carrying value of certain intangible assets due to
the reduction in the valuation allowance recorded in 2006 related
to future income tax assets acquired as part of business acquisitions
in prior periods.
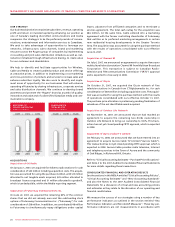
Adjusted Operating Profit
Wireless, Cable and Media all contributed to the increase in
adjusted operating profit. Refer to the individual segment discus-
sions for details of the respective increases in adjusted operating
profit.
Adjusted operating profit increased to $3,703 million in 2007, com-
pared to $2,942 million in 2006. Adjusted operating profit excludes:
(i) the impact of a $452 million one-time non-cash charge related
to the introduction of a cash settlement feature for stock options
during 2007; (ii) stock-based compensation expense of $62 million
in 2007 and $49 million in 2006; (iii) integration and restructuring
expenses of $38 million in 2007 and $18 million in 2006; and (iv) the
impact of a one-time charge of $52 million resulting from the rene-
gotiation of an Internet-related services agreement in 2007.
For details on the determination of adjusted operating profit, which
is a non-GAAP measure, see the “Supplementary Information:
Non-GAAP Calculations” and the “Key Performance Indicators and
Non-GAAP Measures” sections.
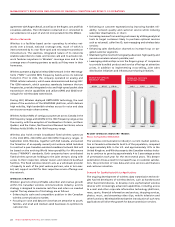
Employees
Employee remuneration represents a material portion of our
expenses. At December 31, 2007, we had approximately 24,400
full-time equivalent employees (“FTEs”) across all of our operating
groups, including our shared services organization and corporate
office, representing an increase of approximately 1,900 from the
level at December 31, 2006. The increase is primarily due to an
increase in our shared services staffing, partially offset by reduc-
tions associated with operational efficiencies. Total remuneration
paid to employees (both full and part-time) in 2007 was approxi-
mately $1,579 million, an increase of approximately $117 million
from $1,462 million in 2006.
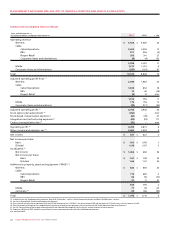
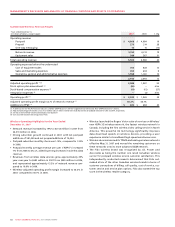
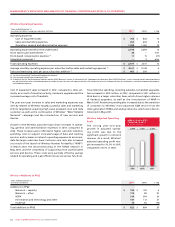
200 8 FINANC IAL AND OPER ATING GUIDANCE
The following table outlines our financial and operational guid-
ance for the full year 2008, which was publicly issued on January 7,
2008. Certain of the measures included below are not defined under
Canadian GAAP. See the sections entitled “Key Performance Indica-
tors and non-GAAP Measures” and “Supplementary Information:
Non-GAAP Calculations” for further details. This information is
forward-looking and should be read in conjunction with the section
above entitled “Caution Regarding Forward-Looking Statements,
Risks and Assumptions”.