Rogers 2007 Annual Report Download - page 26
Download and view the complete annual report
Please find page 26 of the 2007 Rogers annual report below. You can navigate through the pages in the report by either clicking on the pages listed below, or by using the keyword search tool below to find specific information within the annual report.-
 1
1 -
2
-
3
-
4
-
5
-
6
-
7
-
8
-
9
-
10
-
11
-
12
-
13
-
14
-
15
-
 16
16 -
 17
17 -
 18
18 -
 19
19 -
 20
20 -
 21
21 -
 22
22 -
 23
23 -
 24
24 -
 25
25 -
 26
26 -
 27
27 -
 28
28 -
 29
29 -
 30
30 -
 31
31 -
 32
32 -
 33
33 -
 34
34 -
 35
35 -
 36
36 -
37
-
38
-
39
-
40
-
41
-
42
-
43
-
44
-
45
-
46
-
47
-
48
-
49
-
50
-
51
-
52
-
53
-
54
-
55
-
56
-
57
-
58
-
59
-
60
-
61
-
62
-
63
-
64
-
65
-
66
-
67
-
68
-
69
-
70
-
71
-
72
-
73
-
74
-
75
-
76
-
77
-
78
-
79
-
80
-
81
-
82
-
83
-
84
-
85
-
86
-
87
-
88
-
89
-
90
-
91
-
92
-
93
-
94
-
95
-
96
-
97
-
98
-
99
-
100
-
101
-
102
-
103
-
104
-
105
-
106
-
107
-
108
-
109
-
110
-
111
-
112
-
113
-
114
-
115
-
116
-
117
-
118
-
119
-
120
-
121
-
122
-
123
-
124
 |
 |
22 ROGERS COMMUNICATIONS INC. 2007 ANNUAL REPORT
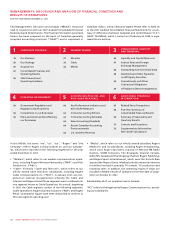
MANAGEMENT’S DISCUSSION AND ANALYSIS OF FINANCIAL CONDITION AND RESULTS OF OPERATIONS
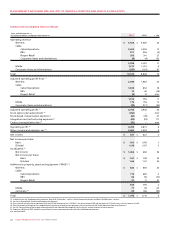
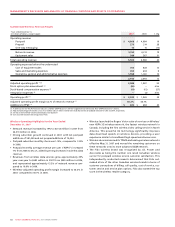
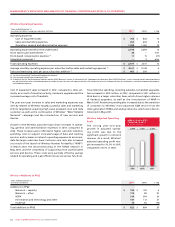
Summarized Consolidated Financial Results
Years ended December 31,
(In millions of dollars, except per share amounts) 2007 2006 % Chg
Operating revenue
Wireless $ 5,503 $ 4,580 20
Cable
Cable Operations 2,603 2,299 13
RBS 571 596 (4)
Rogers Retail 393 310 27
Corporate items and eliminations (9) (4) 125
3,558 3,201 11
Media 1,317 1,210 9
Corporate items and eliminations (255) (153) 67
Total 10,123 8,838 15
Adjusted operating profit (loss) (1)
Wireless 2,589 1,987 30
Cable
Cable Operations 1,008 854 18
RBS 12 49 (76)
Rogers Retail (4) 13 n/m
1,016 916 11
Media 176 156 13
Corporate items and eliminations (78) (117) (33)
Adjusted operating profit (1) 3,703 2,942 26
Stock option plan amendment (2) (452) – n/m
Stock-based compensation expense (2) (62) (49) 27
Integration and restructuring expenses (3) (38) (18) 111
Contract renegotiation fee (4) (52) – n/m
Operating profit (1) 3,099 2,875 8
Other income and expense, net (5) 2,462 2,253 9
Net income $ 637 $ 622 2
Net income per share:
Basic $ 1.00 $ 0.99 1
Diluted 0.99 0.97 2
As adjusted: (1)
Net income $ 1,066 $ 684 56
Net income per share:
Basic $ 1.67 $ 1.08 55
Diluted 1.66 1.07 55
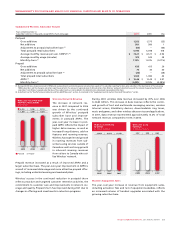
Additions to property, plant and equipment (“PP&E”) (1)
Wireless $ 822 $ 684 20
Cable
Cable Operations 710 685 4
RBS 83 98 (15)
Rogers Retail 21 11 91
814 794 3
Media 77 48 60
Corporate (6) 83 186 (55)
Total $ 1,796 $ 1,712 5
(1) As defined. See the “Supplementary Information: Non-GAAP Calculations” and the “Key Performance Indicators and Non-GAAP Measures” sections.
(2) See the section entitled “Stock-based Compensation Expense”.
(3) Costs incurred related to the integration of Fido and Call-Net Enterprises Inc. (“Call-Net”), the restructuring of RBS and the closure of 21 Retail stores in the first quarter of 2006.
(4) One-time charge resulting from the renegotiation of an Internet-related services agreement. See the section entitled “Cable Operations Operating Expenses”.
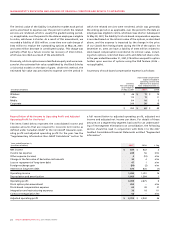
(5) See the “Reconciliation of Net Income to Operating Profit and Adjusted Operating Profit for the Period” section for details of these amounts.
(6) Corporate additions to PP&E include the acquisition of various corporate properties and related building improvements.
n/m: not meaningful.