Rogers 2007 Annual Report Download - page 78
Download and view the complete annual report
Please find page 78 of the 2007 Rogers annual report below. You can navigate through the pages in the report by either clicking on the pages listed below, or by using the keyword search tool below to find specific information within the annual report.-
 1
1 -
2
-
3
-
4
-
5
-
6
-
7
-
8
-
9
-
10
-
11
-
12
-
13
-
14
-
15
-
16
-
17
-
18
-
19
-
20
-
21
-
22
-
23
-
24
-
25
-
26
-
27
-
28
-
29
-
30
-
31
-
32
-
33
-
34
-
35
-
36
-
37
-
38
-
39
-
40
-
41
-
42
-
43
-
44
-
45
-
46
-
47
-
48
-
49
-
50
-
51
-
52
-
53
-
54
-
55
-
56
-
57
-
58
-
59
-
60
-
61
-
62
-
63
-
64
-
65
-
66
-
67
-
 68
68 -
 69
69 -
 70
70 -
 71
71 -
 72
72 -
 73
73 -
 74
74 -
 75
75 -
 76
76 -
 77
77 -
 78
78 -
 79
79 -
 80
80 -
 81
81 -
 82
82 -
 83
83 -
 84
84 -
 85
85 -
 86
86 -
 87
87 -
 88
88 -
89
-
90
-
91
-
92
-
93
-
94
-
95
-
96
-
97
-
98
-
99
-
100
-
101
-
102
-
103
-
104
-
105
-
106
-
107
-
108
-
109
-
110
-
111
-
112
-
113
-
114
-
115
-
116
-
117
-
118
-
119
-
120
-
121
-
122
-
123
-
124
 |
 |

74 ROGERS COMMUNICATIONS INC. 2007 ANNUAL REPORT
MANAGEMENT’S DISCUSSION AND ANALYSIS OF FINANCIAL CONDITION AND RESULTS OF OPERATIONS
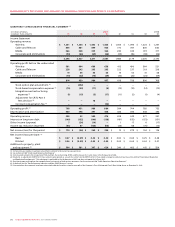
WIRELESS NON-GAAP CALCULATIONS (1)
Years ended December 31,
(In millions of dollars, subscribers in thousands, except ARPU figures and operating profit margin) 2007 2006
Postpaid ARPU (monthly)
Postpaid (voice and data) revenue $ 4,868 $ 4,084
Divided by: average postpaid wireless voice and data subscribers 5,618 5,059
Divided by: 12 months 12 12
$ 72.21 $ 67.27
Prepaid ARPU (monthly)
Prepaid (voice and data) revenue $ 273 $ 214
Divided by: average prepaid subscribers 1,382 1,322
Divided by: 12 months 12 12
$ 16.46 $ 13.49
Cost of acquisition per gross addition
Total sales and marketing expenses $ 653 $ 604
Equipment margin loss (acquisition related) 149 196
$ 802 $ 800
Divided by: total gross wireless additions (postpaid, prepaid and one-way messaging) 1,998 2,007
$ 401 $ 399
Operating expense per average subscriber (monthly)
Operating, general and administrative expenses $ 1,558 $ 1,361
Equipment margin loss (retention related) 205 165
$ 1,763 $ 1,526
Divided by: average total wireless subscribers 7,128 6,528
Divided by: 12 months 12 12
$ 20.61 $ 19.48
Equipment margin loss
Equipment sales $ 349 $ 267
Cost of equipment sales (703) (628)
$ (354) $ (361)
Acquisition related $ (149) $ (196)
Retention related (205) (165)
$ (354) $ (361)
Adjusted operating profit margin
Adjusted operating profit $ 2,589 $ 1,987
Divided by network revenue 5,154 4,313
Adjusted operating profit margin 50.2% 46.1%
(1) For definitions of key performance indicators and non-GAAP measures, see “Key Performance Indicators and Non-GAAP Measures” section.