Pitney Bowes 2007 Annual Report Download - page 99
Download and view the complete annual report
Please find page 99 of the 2007 Pitney Bowes annual report below. You can navigate through the pages in the report by either clicking on the pages listed below, or by using the keyword search tool below to find specific information within the annual report.-
 1
1 -
2
-
3
-
4
-
5
-
6
-
7
-
8
-
9
-
10
-
11
-
12
-
13
-
14
-
15
-
16
-
17
-
18
-
19
-
20
-
21
-
22
-
23
-
24
-
25
-
26
-
27
-
28
-
29
-
30
-
31
-
32
-
33
-
34
-
35
-
36
-
37
-
38
-
39
-
40
-
41
-
42
-
43
-
44
-
45
-
46
-
47
-
48
-
49
-
50
-
51
-
52
-
53
-
54
-
55
-
56
-
57
-
58
-
59
-
60
-
61
-
62
-
63
-
64
-
65
-
66
-
67
-
68
-
69
-
70
-
71
-
72
-
73
-
74
-
75
-
76
-
77
-
78
-
79
-
80
-
81
-
82
-
83
-
84
-
85
-
86
-
87
-
88
-
 89
89 -
 90
90 -
 91
91 -
 92
92 -
 93
93 -
 94
94 -
 95
95 -
 96
96 -
 97
97 -
 98
98 -
 99
99 -
 100
100 -
 101
101 -
 102
102 -
 103
103 -
 104
104 -
 105
105 -
 106
106 -
 107
107 -
 108
108 -
 109
109 -
110
 |
 |

PITNEY BOWES INC.
NOTES TO CONSOLIDATED FINANCIAL STATEMENTS
(Tabular dollars in thousands, except per share data)
81
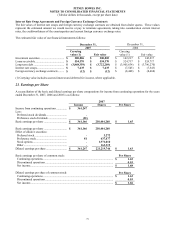
22. Quarterly Financial Data (unaudited)
Summarized quarterly financial data for 2007 and 2006 follows:
2007 First
Quarter
Second
Quarter
Third
Quarter
Fourth
Quarter
Full Year
Total revenue...................................$ 1,414,237 $ 1,543,034 $ 1,508,277 $ 1,664,247 $ 6,129,795
Gross profit (1) ................................ 756,734 837,725 799,143 865,438 3,259,040
Restructuring charges and
asset impairments ........................
-
-
4,300
259,713
264,013
Income (loss) from continuing
operations ....................................
146,584
153,581
129,240
(68,158)
361,247
Income (loss) from discontinued
operations ....................................
(1,788)
(1,342)
(1,565)
10,229
5,534
Net income (loss)............................. 144,796 152,239 127,675 (57,929) 366,781
Basic earnings (loss) per share:
Continuing operations......................$ 0.67 $ 0.70 $ 0.59 $ (0.32) $ 1.65
Discontinued operations .................. (0.01) (0.01) (0.01) 0.05 0.03
Net income (loss) per share .............$ 0.66 $ 0.69 $ 0.58 $ (0.27) $ 1.68
Diluted earnings (loss) per share:
Continuing operations......................$ 0.66 $ 0.69 $ 0.58 $ (0.31) $ 1.63
Discontinued operations .................. (0.01) (0.01) (0.01) 0.05 0.03
Net income (loss) per share .............$ 0.65 $ 0.68 $ 0.58 $ (0.26) $ 1.66
2006 First
Quarter
Second
Quarter
Third
Quarter
Fourth
Quarter
Full Year
Total revenue...................................$ 1,361,646 $ 1,389,210 $ 1,433,331 $ 1,545,831 $ 5,730,018
Gross profit (1) ................................ 731,720 754,195 769,497 834,279 3,089,691
Restructuring charges ..................... 5,597 5,041 6,771 18,590 35,999
Income from continuing
operations .....................................
136,859
121,252
144,227
163,321
565,659
(Loss) income from discontinued
operations .....................................
16,669
(477,326)
4,393
(4,048)
(460,312)
Net income (loss)............................. 153,528 (356,074) 148,620 159,273 105,347
Basic earnings (loss) per share:
Continuing operations......................$ 0.61 $ 0.55 $ 0.65 $ 0.74 $ 2.54
Discontinued operations .................. 0.07 (2.15) 0.02 (0.02) (2.07)
Net income (loss) per share .............$ 0.68 $ (1.61) $ 0.67 $ 0.72 $ 0.47
Diluted earnings (loss) per share:
Continuing operations......................$ 0.60 $ 0.54 $ 0.64 $ 0.73 $ 2.51
Discontinued operations .................. 0.07 (2.13) 0.02 (0.02) (2.04)
Net income (loss) per share .............$ 0.67 $ (1.59) $ 0.66 $ 0.71 $ 0.47
(1) Gross profit is defined as total revenue less cost of equipment sales, cost of supplies, cost of software, cost of rentals, cost
of support services and cost of business services.
The sum of the quarters and earnings per share amounts may not equal the annual and total amounts due to rounding.