Pitney Bowes 2007 Annual Report Download - page 16
Download and view the complete annual report
Please find page 16 of the 2007 Pitney Bowes annual report below. You can navigate through the pages in the report by either clicking on the pages listed below, or by using the keyword search tool below to find specific information within the annual report.-
 1
1 -
2
-
3
-
4
-
5
-
 6
6 -
 7
7 -
 8
8 -
 9
9 -
 10
10 -
 11
11 -
 12
12 -
 13
13 -
 14
14 -
 15
15 -
 16
16 -
 17
17 -
 18
18 -
 19
19 -
 20
20 -
 21
21 -
 22
22 -
 23
23 -
 24
24 -
 25
25 -
 26
26 -
27
-
28
-
29
-
30
-
31
-
32
-
33
-
34
-
35
-
36
-
37
-
38
-
39
-
40
-
41
-
42
-
43
-
44
-
45
-
46
-
47
-
48
-
49
-
50
-
51
-
52
-
53
-
54
-
55
-
56
-
57
-
58
-
59
-
60
-
61
-
62
-
63
-
64
-
65
-
66
-
67
-
68
-
69
-
70
-
71
-
72
-
73
-
74
-
75
-
76
-
77
-
78
-
79
-
80
-
81
-
82
-
83
-
84
-
85
-
86
-
87
-
88
-
89
-
90
-
91
-
92
-
93
-
94
-
95
-
96
-
97
-
98
-
99
-
100
-
101
-
102
-
103
-
104
-
105
-
106
-
107
-
108
-
109
-
110
 |
 |
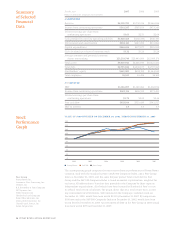
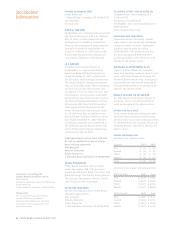
For the year 2007 2006 2005
(Dollars in thousands, except per share amounts)
AS REPORTED
Revenue $6,129,795 $5,730,018 $5,366,936
Income from continuing operations $361,247 $565,659 $473,243
Diluted earnings per share from
continuing operations $1.63 $2.51 $2.04
Cash provided by (used in) operating activities $1,060,465 $(286,574) $530,441
Depreciation and amortization $383,141 $363,258 $331,963
Capital expenditures $264,656 $327,877 $291,550
Cash dividends per share of common stock $1.32 $1.28 $1.24
Average common and potential common
shares outstanding 221,219,746 225,443,060 232,089,178
Total assets $9,549,943 $8,608,944 $10,621,382
Total debt $4,755,842 $4,338,157 $4,707,365
Stockholders’ equity $643,303 $699,189 $1,364,249
Total employees 36,165 34,454 34,165
AS ADJUSTED
EBIT $1,186,097 $1,160,063 $1,063,194
Income from continuing operations $601,114 $606,765 $571,491
Diluted earnings per share from
continuing operations $2.72 $2.69 $2.46
Free cash fl ow $923,914 $523,439 $542,527
EBIT to interest 4.9 5.5 5.7
Summary
of Selected
Financial
Data
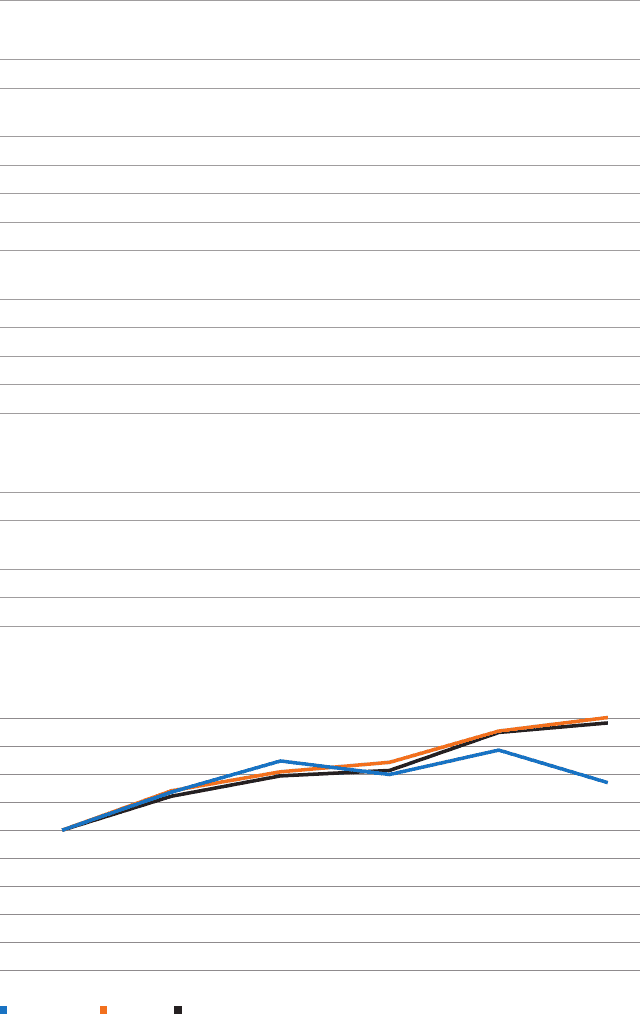
The accompanying graph compares the most recent fi ve-year performance of Pitney Bowes
common stock with the Standard & Poor’s (S&P) 500 Composite Index, and a Peer Group
Index at December 31, 2007, over the same fi ve-year period. Total return for the Peer
Group and the S&P 500 Composite Index is based on market capitalization, weighted for
each year. All information is based on data provided to the Company by three separate
independent organizations, all of which have been licensed by Standard & Poor’s to use
its offi cial total return calculation. The graph shows that on a total return basis, assum-
ing reinvestment of all dividends, $100 invested in the Company’s common stock on
December 31, 2002, would have been worth $135 by December 31, 2007. By comparison,
$100 invested in the S&P 500 Composite Index on December 31, 2002, would have been
worth $183 by December 31, 2007. An investment of $100 in the Peer Group in 2002 would
have been worth $179 on December 31, 2007.
Stock
Performance
Graph
VALUE OF $100 INVESTED ON DECEMBER 31, 2002, THROUGH DECEMBER 31, 2007
180
0
2002
Pitney Bowes S&P 500 Peer Group
2003 2004 2005 2006 2007
20
40
60
80
100
120
140
160
Peer Group
Pitney Bowes Inc.
Automatic Data Processing, Inc.
Diebold, Inc.
R.R. Donnelley & Sons Company
DST Systems, Inc.
FedEx Corporation
Hewlett-Packard Company
Ikon Offi ce Solutions, Inc.
Lexmark International, Inc.
United Parcel Service, Inc.
Xerox Corporation
14 PITNEY BOWES ANNUAL REPORT 2007