Pitney Bowes 2007 Annual Report Download - page 33
Download and view the complete annual report
Please find page 33 of the 2007 Pitney Bowes annual report below. You can navigate through the pages in the report by either clicking on the pages listed below, or by using the keyword search tool below to find specific information within the annual report.-
 1
1 -
2
-
3
-
4
-
5
-
6
-
7
-
8
-
9
-
10
-
11
-
12
-
13
-
14
-
15
-
16
-
17
-
18
-
19
-
20
-
21
-
22
-
 23
23 -
 24
24 -
 25
25 -
 26
26 -
 27
27 -
 28
28 -
 29
29 -
 30
30 -
 31
31 -
 32
32 -
 33
33 -
 34
34 -
 35
35 -
 36
36 -
 37
37 -
 38
38 -
 39
39 -
 40
40 -
 41
41 -
 42
42 -
 43
43 -
44
-
45
-
46
-
47
-
48
-
49
-
50
-
51
-
52
-
53
-
54
-
55
-
56
-
57
-
58
-
59
-
60
-
61
-
62
-
63
-
64
-
65
-
66
-
67
-
68
-
69
-
70
-
71
-
72
-
73
-
74
-
75
-
76
-
77
-
78
-
79
-
80
-
81
-
82
-
83
-
84
-
85
-
86
-
87
-
88
-
89
-
90
-
91
-
92
-
93
-
94
-
95
-
96
-
97
-
98
-
99
-
100
-
101
-
102
-
103
-
104
-
105
-
106
-
107
-
108
-
109
-
110
 |
 |

15
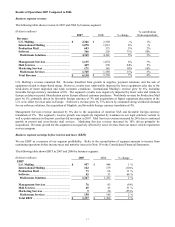
Results of Operations 2006 Compared to 2005
Business segment revenue
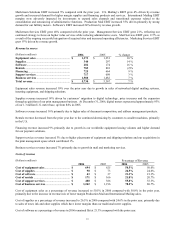
The following table shows revenue in 2006 and 2005 by business segment:
(Dollars in millions)
2006
2005
% change
% contribution
from acquisitions
Revenue:
U.S. Mailing.................................................. $ 2,350 $ 2,260 4% 1%
International Mailing .................................. 1,013 917 10% 3%
Production Mail ........................................... 575 534 8% 1%
Software........................................................ 203 174 16% 8%
Mailstream Solutions................................. 4,141 3,885 7% 2%
Management Services.................................. 1,074 1,072 -% 2%
Mail Services ................................................ 370 335 10% -%
Marketing Services...................................... 145 75 93% 68%
Mailstream Services .................................. 1,589 1,482 7% 5%
Total Revenue ................................................ $ 5,730 $ 5,367 7% 2%
Mailstream Solutions revenue increased 7% over the prior year driven by growth in our worldwide operations, and the
acquisitions of Print, Inc. and Emtex in 2006 and Danka Canada in 2005. U.S. Mailing’ s revenue grew by 4% due to solid
growth in U.S. equipment sales, supplies, shipping solutions and financing as our meter base continued to transition to new
digital technology and customers took advantage of our broad range of financial offerings. However, revenue continued to
be adversely affected by the ongoing changing mix to more fully featured smaller systems. International Mailing’ s revenue
grew by 10% driven by growth in mailing equipment and supplies. Worldwide revenue for Production Mail grew by 8% due
to placements of inserting systems and strong demand for our advanced, high-speed Infinity metering system in the U.S.,
offset by lower sales in Europe. Software’ s revenue grew by 16% due to sales of document composition, and address
management products.
Mailstream Services revenue increased 7% driven by growth in Mail Services and Marketing Services and the acquisitions of
Advertising Audit Services and PMH Caramanning (collectively AAS) and Ibis Consulting in 2006 and Imagitas as well as
Compulit in 2005. During the year, we expanded our marketing services for the motor vehicle registration process to a sixth
state and launched a catalog request form as an enhanced offering in the USPS move update kit. Management Services
revenue remained flat in 2006 as we continued to focus on enhancing the profitability of this segment. Mail Services revenue
increased by 10% as a result of our continued expansion of our presort and international consolidation network and growth in
our customer base. Revenue growth for Marketing Services was driven by existing and new direct marketing services and
the acquisition of AAS.
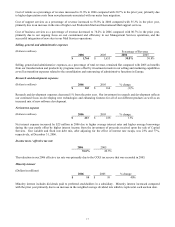
Business segment earnings before interest and taxes (EBIT)
We use EBIT as a measure of our segment profitability. See reconciliation of segment amounts to Income from continuing
operations before income taxes and minority interest in Note 19 to the Consolidated Financial Statements.
The following table shows EBIT in 2006 and 2005 by business segment:
(Dollars in millions) 2006 2005 % change
EBIT
U.S. Mailing.................................................. $ 944 $ 906 4)%
International Mailing .................................. 179 182 (2)%
Production Mail ........................................... 66 49 35)%
Software........................................................ 33 27 24)%
Mailstream Solutions................................. 1,222 1,164 5)%
Management Services.................................. 83 69 21)%
Mail Services ................................................ 43 20 117)%
Marketing Services...................................... 20 10 97)%
Mailstream Services .................................. 146 99 48)%
Total EBIT ................................................... $ 1,368 $ 1,263 8)%