Pitney Bowes 2007 Annual Report Download - page 71
Download and view the complete annual report
Please find page 71 of the 2007 Pitney Bowes annual report below. You can navigate through the pages in the report by either clicking on the pages listed below, or by using the keyword search tool below to find specific information within the annual report.-
 1
1 -
2
-
3
-
4
-
5
-
6
-
7
-
8
-
9
-
10
-
11
-
12
-
13
-
14
-
15
-
16
-
17
-
18
-
19
-
20
-
21
-
22
-
23
-
24
-
25
-
26
-
27
-
28
-
29
-
30
-
31
-
32
-
33
-
34
-
35
-
36
-
37
-
38
-
39
-
40
-
41
-
42
-
43
-
44
-
45
-
46
-
47
-
48
-
49
-
50
-
51
-
52
-
53
-
54
-
55
-
56
-
57
-
58
-
59
-
60
-
 61
61 -
 62
62 -
 63
63 -
 64
64 -
 65
65 -
 66
66 -
 67
67 -
 68
68 -
 69
69 -
 70
70 -
 71
71 -
 72
72 -
 73
73 -
 74
74 -
 75
75 -
 76
76 -
 77
77 -
 78
78 -
 79
79 -
 80
80 -
 81
81 -
82
-
83
-
84
-
85
-
86
-
87
-
88
-
89
-
90
-
91
-
92
-
93
-
94
-
95
-
96
-
97
-
98
-
99
-
100
-
101
-
102
-
103
-
104
-
105
-
106
-
107
-
108
-
109
-
110
 |
 |

PITNEY BOWES INC.
NOTES TO CONSOLIDATED FINANCIAL STATEMENTS
(Tabular dollars in thousands, except per share data)
53
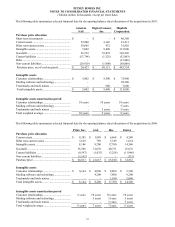
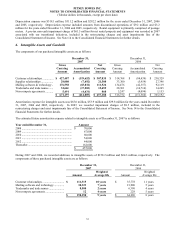
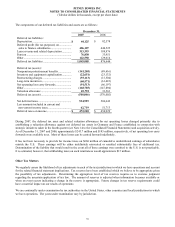
Allocation of the purchase price to the assets acquired and liabilities assumed has not been finalized for MapInfo, Asterion
SAS and Digital Cement, Inc. The purchase price allocation for these acquisitions will be finalized upon the completion of
working capital closing adjustments and fair value analyses. Final determination of the purchase price and fair values to be
assigned may result in adjustments to the preliminary estimated values assigned at the date of acquisition. The amount of tax
deductible goodwill added from acquisitions in 2007 and 2006 was $27.5 million and $98.0 million, respectively.
During 2007 and 2006, we also completed several smaller acquisitions, the cost of which was $86.6 million and $43.1
million, respectively. These acquisitions did not have a material impact on our financial results.
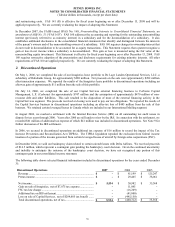
Consolidated impact of acquisitions
The condensed consolidated financial statements include the results of operations of the acquired businesses from their
respective dates of acquisition.
The following table provides unaudited pro forma consolidated revenue for the years ended December 31, 2007 and 2006 as
if our acquisitions had been acquired on January 1 of each year presented:
2007 2006
Total revenue ..................................................... $ 6,252,694 $ 6,078,392
The pro forma earnings of these acquisitions for 2007 and 2006 reduced our diluted earnings per share by approximately 6
cents, primarily due to the purchase accounting alignment for MapInfo. The pro forma consolidated results do not purport to
be indicative of the actual results if the acquisitions had occurred on the dates indicated or that may result in the future.
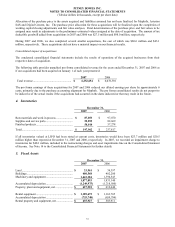
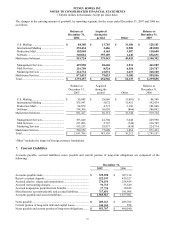
4. Inventories
December 31,
2007
2006
Raw materials and work in process ....................... $ 87,053 $ 97,870
Supplies and service parts...................................... 52,895 82,669
Finished products................................................... 58,014 57,278
Total.......................................................................
$ 197,962
$ 237,817
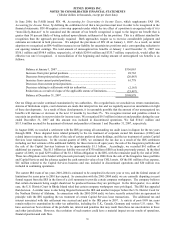
If all inventories valued at LIFO had been stated at current costs, inventories would have been $23.7 million and $20.5
million higher than reported at December 31, 2007 and 2006, respectively. In 2007, we recorded an impairment charge to
inventories for $48.1 million, included in the restructuring charges and asset impairments line on the Consolidated Statement
of Income. See Note 14 to the Consolidated Financial Statements for further details.
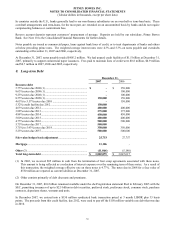
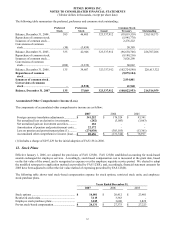
5. Fixed Assets
December 31,
2007
2006
Land....................................................................... $ 33,961
$ 34,397
Buildings................................................................ 400,548
402,200
Machinery and equipment ..................................... 1,443,384
1,394,543
1,877,893
1,831,140
Accumulated depreciation ..................................... (1,249,975) (1,218,500)
Property, plant and equipment, net ........................ $ 627,918
$ 612,640
Rental equipment................................................... $ 1,189,675
$ 1,163,705
Accumulated depreciation ..................................... (753,748) (659,794)
Rental property and equipment, net ....................... $ 435,927
$ 503,911