Pitney Bowes 2007 Annual Report Download - page 86
Download and view the complete annual report
Please find page 86 of the 2007 Pitney Bowes annual report below. You can navigate through the pages in the report by either clicking on the pages listed below, or by using the keyword search tool below to find specific information within the annual report.-
 1
1 -
2
-
3
-
4
-
5
-
6
-
7
-
8
-
9
-
10
-
11
-
12
-
13
-
14
-
15
-
16
-
17
-
18
-
19
-
20
-
21
-
22
-
23
-
24
-
25
-
26
-
27
-
28
-
29
-
30
-
31
-
32
-
33
-
34
-
35
-
36
-
37
-
38
-
39
-
40
-
41
-
42
-
43
-
44
-
45
-
46
-
47
-
48
-
49
-
50
-
51
-
52
-
53
-
54
-
55
-
56
-
57
-
58
-
59
-
60
-
61
-
62
-
63
-
64
-
65
-
66
-
67
-
68
-
69
-
70
-
71
-
72
-
73
-
74
-
75
-
 76
76 -
 77
77 -
 78
78 -
 79
79 -
 80
80 -
 81
81 -
 82
82 -
 83
83 -
 84
84 -
 85
85 -
 86
86 -
 87
87 -
 88
88 -
 89
89 -
 90
90 -
 91
91 -
 92
92 -
 93
93 -
 94
94 -
 95
95 -
 96
96 -
97
-
98
-
99
-
100
-
101
-
102
-
103
-
104
-
105
-
106
-
107
-
108
-
109
-
110
 |
 |

PITNEY BOWES INC.
NOTES TO CONSOLIDATED FINANCIAL STATEMENTS
(Tabular dollars in thousands, except per share data)
68
At December 31, 2007 there are 8,800 shares of our common stock included in the plan assets of our pension plans.
We anticipate making contributions of up to $10 million to both our U.S. and foreign pension plans during 2008.
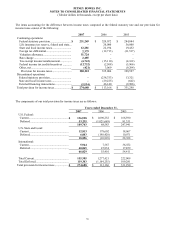
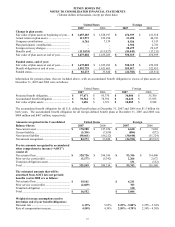
The components of the net periodic benefit cost for defined pension plans are as follows:
United States Foreign
2007 2006 2005
2007 2006 2005
Service cost..................................
$
28,204
$
26,495 $ 29,241 $ 12,797 $ 11,207 $ 8,881
Interest cost.................................. 93,977 91,652 90,993 27,627 22,666 20,899
Expected return on plan assets..... (127,070) (125,204) (123,498) (36,961) (31,338) (26,180)
Amortization of transition cost .... -- - (694) (654) (624)
Amortization of prior service cost (2,165) (2,139) (2,123) 663 618 899
Recognized net actuarial loss....... 29,860 34,881 27,021 7,347 9,516 6,038
Curtailment .................................. -- - 906 883 430
Net periodic benefit cost..............
$
22,806
$
25,685 $ 21,634 $ 11,685 $ 12,898 $ 10,343
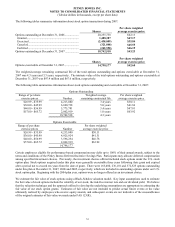
Weighted average assumptions
used to determine net periodic United States Foreign
benefit costs: 2007 2006 2005 2007 2006 2005
Discount rate................................ 5.85% 5.60% 5.75%
2.25% - 5.30% 2.25% - 5.00% 2.25% - 5.75%
Expected return on plan assets..... 8.50% 8.50% 8.50%
3.50% - 7.75% 3.50% - 8.00% 3.50% - 8.25%
Rate of compensation increase .... 4.50% 4.50% 4.75%
2.50% - 4.30% 1.75% - 4.10% 1.75% - 4.00%
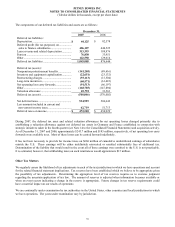
U.S. Pension Plans’ Investment Strategy and Asset Allocation
Our U.S. pension plans’ investment strategy supports the objectives of the fund, which are to maximize returns within
reasonable and prudent levels of risk, to achieve and maintain full funding of the accumulated benefit obligations and the
actuarial liabilities, and to earn a nominal rate of return of at least 8.50%. The fund has established a strategic asset allocation
policy to achieve these objectives. Investments are diversified across asset classes and within each class to minimize the risk
of large losses and are periodically rebalanced. Derivatives, such as swaps, options, forwards and futures contracts may be
used for market exposure, to alter risk/return characteristics and to manage foreign currency exposure. The pension plans’
liabilities, investment objectives and investment managers are reviewed periodically.
The expected long-term rate of return on plan assets is based on historical and projected rates of return for current and
planned asset classes in the plan’ s investment portfolio after analyzing historical experience and future expectations of the
returns and volatility of the various asset classes. The overall expected rate of return for the portfolio was determined based
on the target asset allocations for each asset class, adjusted for historical and expected experience of active portfolio
management results, when compared to the benchmark returns.
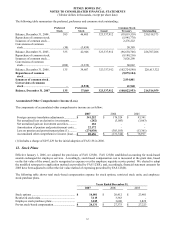
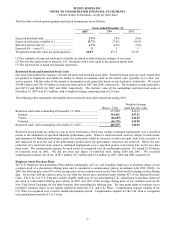
The target allocation for 2008 and the asset allocation for the U.S. pension plan at December 31, 2007 and 2006, by asset
category, are as follows:
Target Allocation Percentage of Plan Assets at December 31,
Asset category 2008 2007 2006
U.S. equities ................................................................. 40% 42%
49%
Non-U.S. equities ......................................................... 20% 23%
23%
Fixed income................................................................ 30% 28%
23%
Real estate .................................................................... 5% 6%
5%
Private equity................................................................ 5% 1%
-%
Total ............................................................................. 100% 100%
100%
The fair value of plan assets was $1.7 billion at December 31, 2007 and 2006 and the expected long-term rate of return on
these plan assets was 8.50% in 2007 and 2006.