Pitney Bowes 2007 Annual Report Download - page 82
Download and view the complete annual report
Please find page 82 of the 2007 Pitney Bowes annual report below. You can navigate through the pages in the report by either clicking on the pages listed below, or by using the keyword search tool below to find specific information within the annual report.-
 1
1 -
2
-
3
-
4
-
5
-
6
-
7
-
8
-
9
-
10
-
11
-
12
-
13
-
14
-
15
-
16
-
17
-
18
-
19
-
20
-
21
-
22
-
23
-
24
-
25
-
26
-
27
-
28
-
29
-
30
-
31
-
32
-
33
-
34
-
35
-
36
-
37
-
38
-
39
-
40
-
41
-
42
-
43
-
44
-
45
-
46
-
47
-
48
-
49
-
50
-
51
-
52
-
53
-
54
-
55
-
56
-
57
-
58
-
59
-
60
-
61
-
62
-
63
-
64
-
65
-
66
-
67
-
68
-
69
-
70
-
71
-
 72
72 -
 73
73 -
 74
74 -
 75
75 -
 76
76 -
 77
77 -
 78
78 -
 79
79 -
 80
80 -
 81
81 -
 82
82 -
 83
83 -
 84
84 -
 85
85 -
 86
86 -
 87
87 -
 88
88 -
 89
89 -
 90
90 -
 91
91 -
 92
92 -
93
-
94
-
95
-
96
-
97
-
98
-
99
-
100
-
101
-
102
-
103
-
104
-
105
-
106
-
107
-
108
-
109
-
110
 |
 |

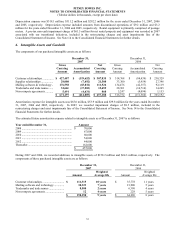
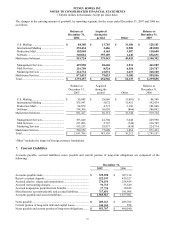
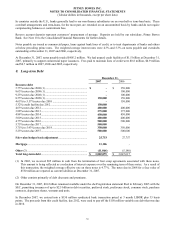
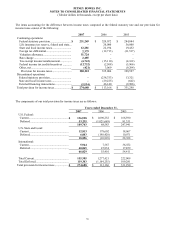
PITNEY BOWES INC.
NOTES TO CONSOLIDATED FINANCIAL STATEMENTS
(Tabular dollars in thousands, except per share data)
64
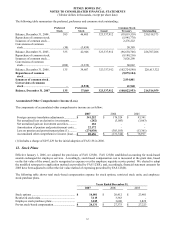
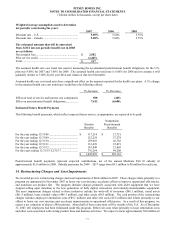
The following tables summarize information about stock option transactions during 2007:
Shares
Per share weighted
average exercise price
Options outstanding at December 31, 2006................... 20,255,738 $42.13
Granted........................................................................
Exercised.....................................................................
Canceled......................................................................
Forfeited ......................................................................
1,488,387
(2,438,009)
(321,048)
(242,550)
$47.17
$35.84
$45.55
$46.19
Options outstanding at December 31, 2007 ................... 18,742,518 $43.23
Shares
Per share weighted
average exercise price
Options exercisable at December 31, 2007.................... 14,798,177 $42.60
The weighted-average remaining contractual life of the total options outstanding and options exercisable at December 31,
2007 was 4.3 years and 3.3 years, respectively. The intrinsic value of the total options outstanding and options exercisable at
December 31, 2007 was $97.4 million and $67.6 million, respectively.
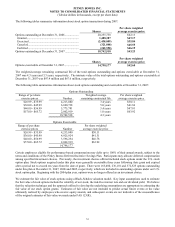
The following table summarizes information about stock options outstanding and exercisable at December 31, 2007:
Options Outstanding
Range of per share
exercise prices
Number
Weighted average
remaining contractual life
Per share weighted
average exercise price
$26.99 - $35.99 4,213,080 3.4 years $30.11
$36.00 - $45.99 6,690,738 5.0 years $41.86
$46.00 - $56.99 5,775,781 5.4 years $47.01
$57.00 - $65.72 2,062,919 1.0 years $63.92
18,742,518 4.3 years
Options Exercisable
Range of per share
exercise prices
Number
Per share weighted
average exercise price
$26.99 - $35.99 4,213,080 $30.11
$36.00 - $45.99 4,925,924 $41.31
$46.00 - $56.99 3,596,254 $46.78
$57.00 - $65.72 2,062,919 $63.92
14,798,177
Certain employees eligible for performance-based compensation may defer up to 100% of their annual awards, subject to the
terms and conditions of the Pitney Bowes Deferred Incentive Savings Plan. Participants may allocate deferred compensation
among specified investment choices. Previously, the investment choices offered included stock options under the U.S. stock
option plan. Stock options acquired under this plan were generally exercisable three years following their grant and expired
after a period not to exceed ten years from the date of grant. There were 163,480, 236,101 and 372,525 options outstanding
under this plan at December 31, 2007, 2006 and 2005, respectively, which are included in outstanding options under our U.S.
stock option plan. Beginning with the 2004 plan year, options were no longer offered as an investment choice.
We estimate the fair value of stock options using a Black-Scholes valuation model. Key input assumptions used to estimate
the fair value of stock options include the volatility of our stock, the risk-free interest rate and our dividend yield. We believe
that the valuation technique and the approach utilized to develop the underlying assumptions are appropriate in estimating the
fair value of our stock option grants. Estimates of fair value are not intended to predict actual future events or the value
ultimately realized by employees who receive equity awards, and subsequent events are not indicative of the reasonableness
of the original estimates of fair value we made under FAS 123(R).