Pitney Bowes 2007 Annual Report Download - page 30
Download and view the complete annual report
Please find page 30 of the 2007 Pitney Bowes annual report below. You can navigate through the pages in the report by either clicking on the pages listed below, or by using the keyword search tool below to find specific information within the annual report.-
 1
1 -
2
-
3
-
4
-
5
-
6
-
7
-
8
-
9
-
10
-
11
-
12
-
13
-
14
-
15
-
16
-
17
-
18
-
19
-
 20
20 -
 21
21 -
 22
22 -
 23
23 -
 24
24 -
 25
25 -
 26
26 -
 27
27 -
 28
28 -
 29
29 -
 30
30 -
 31
31 -
 32
32 -
 33
33 -
 34
34 -
 35
35 -
 36
36 -
 37
37 -
 38
38 -
 39
39 -
 40
40 -
41
-
42
-
43
-
44
-
45
-
46
-
47
-
48
-
49
-
50
-
51
-
52
-
53
-
54
-
55
-
56
-
57
-
58
-
59
-
60
-
61
-
62
-
63
-
64
-
65
-
66
-
67
-
68
-
69
-
70
-
71
-
72
-
73
-
74
-
75
-
76
-
77
-
78
-
79
-
80
-
81
-
82
-
83
-
84
-
85
-
86
-
87
-
88
-
89
-
90
-
91
-
92
-
93
-
94
-
95
-
96
-
97
-
98
-
99
-
100
-
101
-
102
-
103
-
104
-
105
-
106
-
107
-
108
-
109
-
110
 |
 |

12
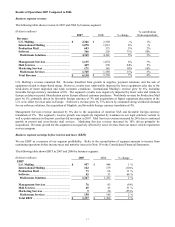
U.S. Mailing’ s EBIT grew 1% due to the increase in mix of higher margin revenue from payment solutions and supplies as
well as our continued focus on controlling operating expenses. International Mailing EBIT decreased 10%. The segment’ s
profitability was adversely impacted by lower equipment sales and rentals in Europe, and incremental costs in 2007 related to
back office operations, including the outsourcing of our European order and financial processing. Production Mail EBIT
increased 11% driven primarily by revenue growth and net legal recoveries of approximately $4 million in Europe. Software
EBIT increased 66%, driven by revenue growth partially offset by integration costs for the MapInfo acquisition.
Management Services EBIT decreased 9% due to continued weakness in our legal solutions vertical. Mail Services EBIT
grew by 51% driven by revenue growth, successful integration of acquired sites, and increased operating efficiencies.
Marketing Services EBIT decreased 55%, principally due to lower revenue in our motor vehicle registration services
program.
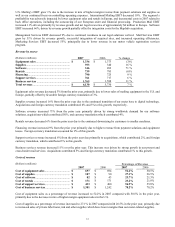
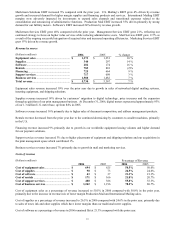
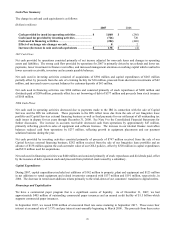
Revenue by source
(Dollars in millions) 2007 2006 % change
Equipment sales ............................................... $ 1,336 $ 1,373 (3)%
Supplies............................................................. 393 340 16)%
Software............................................................ 346 202 71)%
Rentals .............................................................. 739 785 (6)%
Financing .......................................................... 790 725 9)%
Support services............................................... 761 717 6)%
Business services .............................................. 1,765 1,588 11)%
Total revenue.................................................... $ 6,130 $ 5,730 7)%
Equipment sales revenue decreased 3% from the prior year, primarily due to lower sales of mailing equipment in the U.S. and
Europe, partially offset by favorable foreign currency translation of 3%.
Supplies revenue increased 16% from the prior year due to the continued transition of our meter base to digital technology.
Acquisitions and foreign currency translation contributed 4% and 3% to this growth, respectively.
Software revenue increased 71% from the prior year primarily driven by strong worldwide demand for our software
solutions, acquisitions which contributed 50%, and currency translation which contributed 4%.
Rentals revenue decreased 6% from the prior year due to the continued downsizing by customers to smaller machines.
Financing revenue increased 9% from the prior year primarily due to higher revenue from payment solutions and equipment
leases. Foreign currency translation accounted for 2% of this growth.
Support services revenue increased 6% from the prior year due primarily to acquisitions, which contributed 2%, and foreign
currency translation, which contributed 3% to this growth.
Business services revenue increased 11% over the prior year. This increase was driven by strong growth in our presort and
cross-border mail services. Acquisitions contributed 5% and foreign currency translation contributed 1% to this growth.
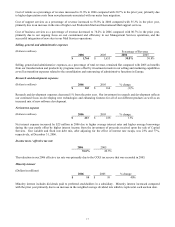
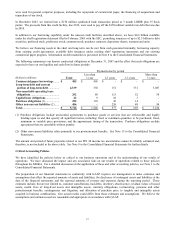
Costs of revenue
(Dollars in millions) Percentage of Revenue
2007 2006 2007 2006
Cost of equipment sales ................................... $ 697 $ 694 52.2% 50.5%
Cost of supplies ................................................ $ 107 $ 90 27.1% 26.5%
Cost of software................................................ $ 82 $ 43 23.7% 21.3%
Cost of rentals .................................................. $ 171 $ 171 23.2% 21.8%
Cost of support services................................... $ 433 $ 400 56.9% 55.8%
Cost of business services.................................. $ 1,381 $ 1,242 78.2% 78.2%
Cost of equipment sales as a percentage of revenue increased to 52.2% in 2007 compared with 50.5% in the prior year,
primarily due to the decrease in mix of higher margin equipment sales in the U.S.
Cost of supplies as a percentage of revenue increased to 27.1% in 2007 compared with 26.5% in the prior year, primarily due
to increased sales of private label toner, ink and other supplies which have lower margins than our meter-related supplies.