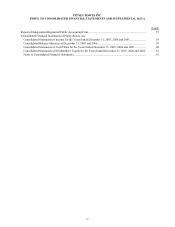
Pitney Bowes 2007 Annual Report Download - page 57
Download and view the complete annual report
Please find page 57 of the 2007 Pitney Bowes annual report below. You can navigate through the pages in the report by either clicking on the pages listed below, or by using the keyword search tool below to find specific information within the annual report.-
 1
1 -
2
-
3
-
4
-
5
-
6
-
7
-
8
-
9
-
10
-
11
-
12
-
13
-
14
-
15
-
16
-
17
-
18
-
19
-
20
-
21
-
22
-
23
-
24
-
25
-
26
-
27
-
28
-
29
-
30
-
31
-
32
-
33
-
34
-
35
-
36
-
37
-
38
-
39
-
40
-
41
-
42
-
43
-
44
-
45
-
46
-
 47
47 -
 48
48 -
 49
49 -
 50
50 -
 51
51 -
 52
52 -
 53
53 -
 54
54 -
 55
55 -
 56
56 -
 57
57 -
 58
58 -
 59
59 -
 60
60 -
 61
61 -
 62
62 -
 63
63 -
 64
64 -
 65
65 -
 66
66 -
 67
67 -
68
-
69
-
70
-
71
-
72
-
73
-
74
-
75
-
76
-
77
-
78
-
79
-
80
-
81
-
82
-
83
-
84
-
85
-
86
-
87
-
88
-
89
-
90
-
91
-
92
-
93
-
94
-
95
-
96
-
97
-
98
-
99
-
100
-
101
-
102
-
103
-
104
-
105
-
106
-
107
-
108
-
109
-
110
 |
 |

39
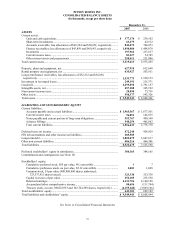
PITNEY BOWES INC.
CONSOLIDATED BALANCE SHEETS
(In thousands, except per share data)
December 31,
2007 2006
ASSETS
Current assets:
Cash and cash equivalents ..................................................................................... $ 377,176
$ 239,102
Short-term investments .......................................................................................... 63,279
62,512
Accounts receivable, less allowances of $49,324 and $50,052, respectively ........ 841,072
744,073
Finance receivables, less allowances of $45,859 and $45,643, respectively ......... 1,498,486
1,404,070
Inventories ............................................................................................................. 197,962
237,817
Current income taxes ............................................................................................. 83,227
54,785
Other current assets and prepayments.................................................................... 258,411
231,096
Total current assets.......................................................................................................
3,319,613
2,973,455
Property, plant and equipment, net............................................................................... 627,918
612,640
Rental property and equipment, net ............................................................................. 435,927
503,911
Long-term finance receivables, less allowances of $32,512 and $36,856,
respectively ................................................................................................................
1,533,773
1,530,153
Investment in leveraged leases..................................................................................... 249,191
215,371
Goodwill....................................................................................................................... 2,299,858
1,791,157
Intangible assets, net .................................................................................................... 457,188
365,192
Non-current income taxes ............................................................................................ 28,098
73,739
Other assets .................................................................................................................. 598,377
543,326
Total assets................................................................................................................... $ 9,549,943 $ 8,608,944
LIABILITIES AND STOCKHOLDERS’ EQUITY
Current liabilities:
Accounts payable and accrued liabilities ............................................................... $ 1,965,567 $ 1,677,501
Current income taxes ............................................................................................ 96,851
142,835
Notes payable and current portion of long-term obligations.................................. 953,767
490,540
Advance billings .................................................................................................... 540,254
465,862
Total current liabilities...........................................................................................
3,556,439
2,776,738
Deferred taxes on income............................................................................................. 472,240
454,929
FIN 48 uncertainties and other income tax liabilities................................................... 285,505
-
Long-term debt............................................................................................................. 3,802,075
3,847,617
Other non-current liabilities ......................................................................................... 406,216
446,306
Total liabilities ............................................................................................................. 8,522,475
7,525,590
Preferred stockholders’ equity in subsidiaries.............................................................. 384,165
384,165
Commitments and contingencies (see Note 15)
Stockholders’ equity:
Cumulative preferred stock, $50 par value, 4% convertible .................................. 7
7
Cumulative preference stock, no par value, $2.12 convertible .............................. 1,003
1,068
Common stock, $1 par value (480,000,000 shares authorized;
323,337,912 shares issued) ...............................................................................
323,338
323,338
Capital in excess of par value ................................................................................ 252,185
235,558
Retained earnings................................................................................................... 4,133,756
4,140,128
Accumulated other comprehensive income ........................................................... 88,656
(131,744)
Treasury stock, at cost (108,822,953 and 102,724,590 shares, respectively) ........ (4,155,642)
(3,869,166)
Total stockholders’ equity............................................................................................ 643,303
699,189
Total liabilities and stockholders’ equity ..................................................................... $ 9,549,943 $ 8,608,944
See Notes to Consolidated Financial Statements