Pitney Bowes 2007 Annual Report Download - page 80
Download and view the complete annual report
Please find page 80 of the 2007 Pitney Bowes annual report below. You can navigate through the pages in the report by either clicking on the pages listed below, or by using the keyword search tool below to find specific information within the annual report.-
 1
1 -
2
-
3
-
4
-
5
-
6
-
7
-
8
-
9
-
10
-
11
-
12
-
13
-
14
-
15
-
16
-
17
-
18
-
19
-
20
-
21
-
22
-
23
-
24
-
25
-
26
-
27
-
28
-
29
-
30
-
31
-
32
-
33
-
34
-
35
-
36
-
37
-
38
-
39
-
40
-
41
-
42
-
43
-
44
-
45
-
46
-
47
-
48
-
49
-
50
-
51
-
52
-
53
-
54
-
55
-
56
-
57
-
58
-
59
-
60
-
61
-
62
-
63
-
64
-
65
-
66
-
67
-
68
-
69
-
 70
70 -
 71
71 -
 72
72 -
 73
73 -
 74
74 -
 75
75 -
 76
76 -
 77
77 -
 78
78 -
 79
79 -
 80
80 -
 81
81 -
 82
82 -
 83
83 -
 84
84 -
 85
85 -
 86
86 -
 87
87 -
 88
88 -
 89
89 -
 90
90 -
91
-
92
-
93
-
94
-
95
-
96
-
97
-
98
-
99
-
100
-
101
-
102
-
103
-
104
-
105
-
106
-
107
-
108
-
109
-
110
 |
 |

PITNEY BOWES INC.
NOTES TO CONSOLIDATED FINANCIAL STATEMENTS
(Tabular dollars in thousands, except per share data)
62
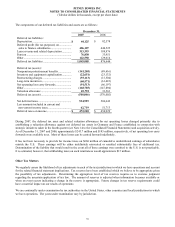
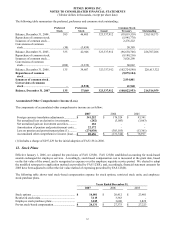
The following table summarizes the preferred, preference and common stock outstanding:
Common Stock
Preferred
Stock
Preference
Stock Issued Treasury Outstanding
Balance, December 31, 2004 . 385 46,405 323,337,912 (93,019,539) 230,318,373
Repurchase of common stock. (5,945,778)
Issuances of common stock ... 2,276,222
Conversions of common
stock.....................................
(50)
(3,459)
58,389
Balance, December 31, 2005 . 335 42,946 323,337,912 (96,630,706) 226,707,206
Repurchase of common stock. (9,180,216)
Issuances of common stock ... 3,026,290
Conversions of common
stock..................................... (200) (3,339) 60,042
Balance, December 31, 2006 . 135 39,607 323,337,912) (102,724,590) 220,613,322)
Repurchase of common
stock ....................................
(9,075,104)
Issuances of common stock . 2,934,801
Conversions of common
stock ....................................
-
(2,538)
41,940
Balance, December 31, 2007 135 37,069 323,337,912 (108,822,953) 214,514,959
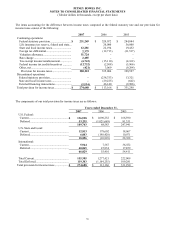
Accumulated Other Comprehensive Income (Loss)
The components of accumulated other comprehensive income are as follow:
2007 2006 2005
Foreign currency translation adjustments ................. $ 341,252
$ 176,524) $ 93,341
Net unrealized loss on derivative investments.......... (282)
(3,083) (3,063)
Net unrealized gain on investment securities............ 352
- -
Amortization of pension and postretirement costs.... 22,172
- -
Loss on pension and postretirement plans (1)........... (274,838)
(305,185) (13,361)
Accumulated other comprehensive income (loss) .... $ 88,656
$ (131,744) $ 76,917
(1) Includes a charge of $297,229 for the initial adoption of FAS 158 in 2006.
12.1Stock Plans
Effective January 1, 2006, we adopted the provisions of FAS 123(R). FAS 123(R) established accounting for stock-based
awards exchanged for employee services. Accordingly, stock-based compensation cost is measured at the grant date, based
on the fair value of the award, and is recognized as expense over the employee requisite service period. We elected to adopt
the modified retrospective application method as provided by FAS 123(R), and, accordingly, financial statement amounts for
2005 have been adjusted to reflect the fair value method of expensing prescribed by FAS 123(R).
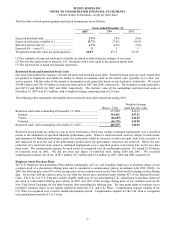
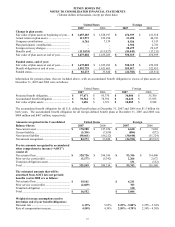
The following table shows total stock-based compensation expense for stock options, restricted stock units, and employee
stock purchase plans.
Years Ended December 31,
2007 2006 2005
Stock options ............................................................ $ 14,001
$ 20,412 $ 23,401
Restricted stock units................................................ 7,115
3,363 -
Employee stock purchase plans ................................ 3,015
3,600 3,822
Pre-tax stock-based compensation ................................ $ 24,131
$ 27,375 $ 27,223