Pitney Bowes 2007 Annual Report Download - page 35
Download and view the complete annual report
Please find page 35 of the 2007 Pitney Bowes annual report below. You can navigate through the pages in the report by either clicking on the pages listed below, or by using the keyword search tool below to find specific information within the annual report.-
 1
1 -
2
-
3
-
4
-
5
-
6
-
7
-
8
-
9
-
10
-
11
-
12
-
13
-
14
-
15
-
16
-
17
-
18
-
19
-
20
-
21
-
22
-
23
-
24
-
 25
25 -
 26
26 -
 27
27 -
 28
28 -
 29
29 -
 30
30 -
 31
31 -
 32
32 -
 33
33 -
 34
34 -
 35
35 -
 36
36 -
 37
37 -
 38
38 -
 39
39 -
 40
40 -
 41
41 -
 42
42 -
 43
43 -
 44
44 -
 45
45 -
46
-
47
-
48
-
49
-
50
-
51
-
52
-
53
-
54
-
55
-
56
-
57
-
58
-
59
-
60
-
61
-
62
-
63
-
64
-
65
-
66
-
67
-
68
-
69
-
70
-
71
-
72
-
73
-
74
-
75
-
76
-
77
-
78
-
79
-
80
-
81
-
82
-
83
-
84
-
85
-
86
-
87
-
88
-
89
-
90
-
91
-
92
-
93
-
94
-
95
-
96
-
97
-
98
-
99
-
100
-
101
-
102
-
103
-
104
-
105
-
106
-
107
-
108
-
109
-
110
 |
 |

17
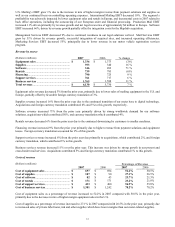
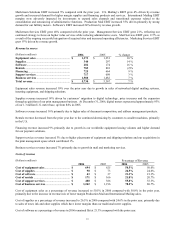
Cost of rentals as a percentage of revenue increased to 21.8% in 2006 compared with 20.7% in the prior year, primarily due
to higher depreciation costs from new placements associated with our meter base migration.
Cost of support services as a percentage of revenue increased to 55.8% in 2006 compared with 55.3% in the prior year,
primarily due to an increase in the mix of higher cost Production Mail and International Mail support services.
Cost of business services as a percentage of revenue decreased to 78.2% in 2006 compared with 80.7% in the prior year,
primarily due to our ongoing focus on cost containment and efficiency in our Management Services operations, and the
successful integration of new sites in our Mail Services operations.
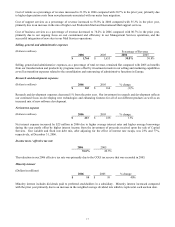
Selling, general and administrative expenses
(Dollars in millions) Percentage of Revenue
2006 2005 2006 2005
$ 1,764
$ 1,655 30.8% 30.8%
Selling, general and administrative expenses, as a percentage of total revenue, remained flat compared with 2005 as benefits
from our transformation and productivity programs were offset by investments made in our selling and marketing capabilities
as well as transition expenses related to the consolidation and outsourcing of administrative functions in Europe.
Research and development expenses
(Dollars in millions) 2006 2005 % change
$ 165 $ 166 (1)%
Research and development expenses decreased 1% from the prior year. Our investment in research and development reflects
our continued focus on developing new technologies and enhancing features for all of our different products as well as an
increased mix of new software development.
Net interest expense
(Dollars in millions) 2006 2005 % change
$ 213
$ 188 13%
Net interest expense increased by $25 million in 2006 due to higher average interest rates and higher average borrowings
during the year partly offset by higher interest income from the investment of proceeds received upon the sale of Capital
Services. Our variable and fixed rate debt mix, after adjusting for the effect of interest rate swaps, was 23% and 77%,
respectively, at December 31, 2006.
Income taxes / effective tax rate
2006 2005
36.6% 40.5%
The reduction in our 2006 effective tax rate was primarily due to the COLI tax reserve that was recorded in 2005.
Minority interest
(Dollars in millions)
2006 2005 % change
$ 14 $ 10 40%
Minority interest includes dividends paid to preferred stockholders in a subsidiary. Minority interest increased compared
with the prior year primarily due to an increase in the weighted average dividend rate which is repriced at each auction date.