Pitney Bowes 2007 Annual Report Download - page 31
Download and view the complete annual report
Please find page 31 of the 2007 Pitney Bowes annual report below. You can navigate through the pages in the report by either clicking on the pages listed below, or by using the keyword search tool below to find specific information within the annual report.-
 1
1 -
2
-
3
-
4
-
5
-
6
-
7
-
8
-
9
-
10
-
11
-
12
-
13
-
14
-
15
-
16
-
17
-
18
-
19
-
20
-
 21
21 -
 22
22 -
 23
23 -
 24
24 -
 25
25 -
 26
26 -
 27
27 -
 28
28 -
 29
29 -
 30
30 -
 31
31 -
 32
32 -
 33
33 -
 34
34 -
 35
35 -
 36
36 -
 37
37 -
 38
38 -
 39
39 -
 40
40 -
 41
41 -
42
-
43
-
44
-
45
-
46
-
47
-
48
-
49
-
50
-
51
-
52
-
53
-
54
-
55
-
56
-
57
-
58
-
59
-
60
-
61
-
62
-
63
-
64
-
65
-
66
-
67
-
68
-
69
-
70
-
71
-
72
-
73
-
74
-
75
-
76
-
77
-
78
-
79
-
80
-
81
-
82
-
83
-
84
-
85
-
86
-
87
-
88
-
89
-
90
-
91
-
92
-
93
-
94
-
95
-
96
-
97
-
98
-
99
-
100
-
101
-
102
-
103
-
104
-
105
-
106
-
107
-
108
-
109
-
110
 |
 |

13
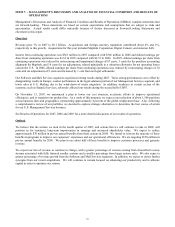
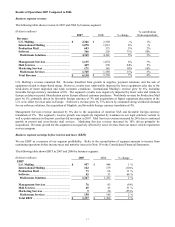
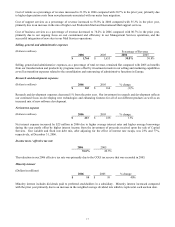
Cost of software as a percentage of revenue increased to 23.7% in 2007 compared with 21.3% in the prior year, primarily due
to the acquisition of MapInfo.
Cost of rentals as a percentage of revenue increased to 23.2% in 2007 compared with 21.8% in the prior year, primarily due
to higher depreciation costs from placements of new digital meters.
Cost of support services as a percentage of revenue increased to 56.9% in 2007 compared with 55.8% in the prior year,
primarily due to an increase in mix of production mail and international mailing revenue.
Cost of business services as a percentage of revenue remained flat at 78.2%. Improving margins in our presort and cross-
border services were offset by lower margins in our legal solutions business.
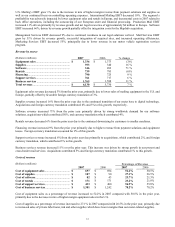
Selling, general and administrative expenses
(Dollars in millions) Percentage of Revenue
2007 2006 2007 2006
$ 1,907
$ 1,764 31.1% 30.8%
Selling, general and administrative expenses, as a percentage of total revenue, increased to 31.1% compared with 30.8% in
the prior year. This increase was due to the impact of acquisitions which offset the benefits from productivity initiatives.
Research and development expenses
(Dollars in millions) 2007 2006 % change
$ 186 $ 165 12%
Research and development expenses increased 12% over the prior year, primarily due to the acquisition of MapInfo. Our
investment in research and development reflects higher expenses for software development and our continued focus on
developing new technologies and enhancing features for all of our different products.
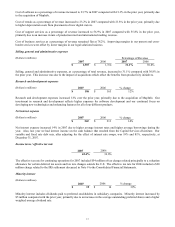
Net interest expense
(Dollars in millions) 2007 2006 % change
$ 242
$ 213 14%
Net interest expense increased 14% in 2007 due to higher average interest rates and higher average borrowings during the
year. Also, last year we had interest income on the cash balance that resulted from the Capital Services divestiture. Our
variable and fixed rate debt mix, after adjusting for the effect of interest rate swaps, was 19% and 81%, respectively, at
December 31, 2007.
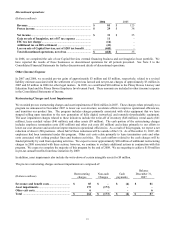
Income taxes / effective tax rate
2007 2006
42.4% 36.6%
The effective tax rate for continuing operations for 2007 included $54 million of tax charges related principally to a valuation
allowance for certain deferred tax assets and tax rate changes outside the U.S. The effective tax rate for 2006 included a $20
million charge related to the IRS settlement discussed in Note 9 to the Consolidated Financial Statements.
Minority interest
(Dollars in millions)
2007 2006 % change
$ 19 $ 14 39%
Minority interest includes dividends paid to preferred stockholders in subsidiary companies. Minority interest increased by
$5 million compared with the prior year, primarily due to an increase in the average outstanding preferred shares and a higher
weighted average dividend rate.