Pitney Bowes 2007 Annual Report Download - page 56
Download and view the complete annual report
Please find page 56 of the 2007 Pitney Bowes annual report below. You can navigate through the pages in the report by either clicking on the pages listed below, or by using the keyword search tool below to find specific information within the annual report.-
 1
1 -
2
-
3
-
4
-
5
-
6
-
7
-
8
-
9
-
10
-
11
-
12
-
13
-
14
-
15
-
16
-
17
-
18
-
19
-
20
-
21
-
22
-
23
-
24
-
25
-
26
-
27
-
28
-
29
-
30
-
31
-
32
-
33
-
34
-
35
-
36
-
37
-
38
-
39
-
40
-
41
-
42
-
43
-
44
-
45
-
 46
46 -
 47
47 -
 48
48 -
 49
49 -
 50
50 -
 51
51 -
 52
52 -
 53
53 -
 54
54 -
 55
55 -
 56
56 -
 57
57 -
 58
58 -
 59
59 -
 60
60 -
 61
61 -
 62
62 -
 63
63 -
 64
64 -
 65
65 -
 66
66 -
67
-
68
-
69
-
70
-
71
-
72
-
73
-
74
-
75
-
76
-
77
-
78
-
79
-
80
-
81
-
82
-
83
-
84
-
85
-
86
-
87
-
88
-
89
-
90
-
91
-
92
-
93
-
94
-
95
-
96
-
97
-
98
-
99
-
100
-
101
-
102
-
103
-
104
-
105
-
106
-
107
-
108
-
109
-
110
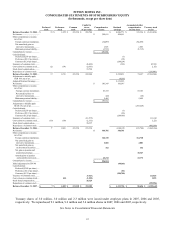
 |
 |

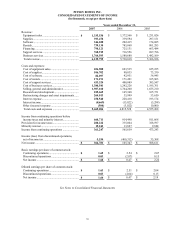
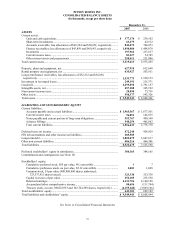
38
PITNEY BOWES INC.
CONSOLIDATED STATEMENTS OF INCOME
(In thousands, except per share data)
Years ended December 31,
2007 2006 2005
Revenue:
Equipment sales .................................................. $ 1,335,538 $ 1,372,566 $ 1,251,026
Supplies............................................................... 393,478
339,594 297,151
Software .............................................................. 346,020
202,415 174,085
Rentals................................................................. 739,130
785,068 801,285
Financing............................................................. 790,121
725,131 663,484
Support services .................................................. 760,915 716,556 697,796
Business services................................................. 1,764,593 1,588,688 1,482,109
Total revenue...................................................... 6,129,795 5,730,018 5,366,936
Costs and expenses:
Cost of equipment sales....................................... 696,900 693,535 625,235
Cost of supplies................................................... 106,702
90,035 73,330
Cost of software .................................................. 82,097
42,951 36,945
Cost of rentals ..................................................... 171,191
171,491 165,963
Cost of support services ...................................... 433,324 400,089 385,547
Cost of business services..................................... 1,380,541 1,242,226 1,195,761
Selling, general and administrative ..................... 1,907,160 1,764,260 1,655,210
Research and development.................................. 185,665 165,368 165,751
Restructuring charges and asset impairments...... 264,013 35,999 53,650
Interest expense................................................... 250,540 228,418 193,174
Interest income.................................................... (8,669) (15,822) (5,298)
Other (income) expense ...................................... (380)
(3,022) 10,000
Total costs and expenses .................................... 5,469,084 4,815,528 4,555,268
Income from continuing operations before
income taxes and minority interest......................
660,711
914,490
811,668
Provision for income taxes.................................... 280,222 335,004 328,597
Minority interest.................................................... 19,242 13,827 9,828
Income from continuing operations ...................... 361,247 565,659 473,243
Income (loss) from discontinued operations,
net of income tax................................................. 5,534
(460,312)
35,368
Net income ............................................................ $ 366,781 $ 105,347 $ 508,611
Basic earnings per share of common stock:
Continuing operations ......................................... $ 1.65 $ 2.54 $ 2.07
Discontinued operations...................................... 0.03 (2.07) 0.15
Net income .......................................................... $ 1.68 $ 0.47 $ 2.22
Diluted earnings per share of common stock:
Continuing operations ......................................... $ 1.63 $ 2.51 $ 2.04
Discontinued operations...................................... 0.03 (2.04) 0.15
Net income .......................................................... $ 1.66 $ 0.47 $ 2.19
See Notes to Consolidated Financial Statements