Pitney Bowes 2007 Annual Report Download - page 96
Download and view the complete annual report
Please find page 96 of the 2007 Pitney Bowes annual report below. You can navigate through the pages in the report by either clicking on the pages listed below, or by using the keyword search tool below to find specific information within the annual report.-
 1
1 -
2
-
3
-
4
-
5
-
6
-
7
-
8
-
9
-
10
-
11
-
12
-
13
-
14
-
15
-
16
-
17
-
18
-
19
-
20
-
21
-
22
-
23
-
24
-
25
-
26
-
27
-
28
-
29
-
30
-
31
-
32
-
33
-
34
-
35
-
36
-
37
-
38
-
39
-
40
-
41
-
42
-
43
-
44
-
45
-
46
-
47
-
48
-
49
-
50
-
51
-
52
-
53
-
54
-
55
-
56
-
57
-
58
-
59
-
60
-
61
-
62
-
63
-
64
-
65
-
66
-
67
-
68
-
69
-
70
-
71
-
72
-
73
-
74
-
75
-
76
-
77
-
78
-
79
-
80
-
81
-
82
-
83
-
84
-
85
-
 86
86 -
 87
87 -
 88
88 -
 89
89 -
 90
90 -
 91
91 -
 92
92 -
 93
93 -
 94
94 -
 95
95 -
 96
96 -
 97
97 -
 98
98 -
 99
99 -
 100
100 -
 101
101 -
 102
102 -
 103
103 -
 104
104 -
 105
105 -
 106
106 -
107
-
108
-
109
-
110
 |
 |

PITNEY BOWES INC.
NOTES TO CONSOLIDATED FINANCIAL STATEMENTS
(Tabular dollars in thousands, except per share data)
78
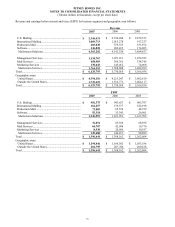
Reconciliation of Segment Amounts to Consolidated Totals:
Years ended December 31,
2007 2006 2005
EBIT:
Total EBIT for reportable segments ................................ $ 1,396,641 $ 1,368,162 $ 1,262,604
Unallocated amounts:
Interest, net .................................................................... (241,871) (212,596) (187,876)
Corporate expense ......................................................... (210,544) (208,099) (199,410)
Restructuring charges and asset impairments ................ (264,013) (35,999) (53,650)
Other items ................................................................... (2,576) 3,022 (10,000)
MapInfo Purchase Accounting ...................................... (16,926) - -
Income from continuing operations
before income taxes and minority interest ..................... $ 660,711
$ 914,490 $ 811,668
Depreciation and amortization:
Total depreciation and amortization for reportable
segments ....................................................................... $ 368,431
$ 336,064 $ 309,032
Corporate depreciation.................................................... 14,710
15,216 14,821
Discontinued operations ................................................. -
11,978 8,110
Consolidated depreciation and amortization................... $ 383,141
$ 363,258 $ 331,963
Capital expenditures:
Total additions for reportable segments.......................... $ 242,133
$ 306,832 $ 283,843
Unallocated amounts ...................................................... 22,523
21,045 7,707
Consolidated capital expenditures ................................... $ 264,656
$ 327,877 $ 291,550
December 31,
2007 2006
Total assets:
Total identifiable assets by reportable segments ............ $ 8,778,474 $ 7,928,437
Cash and cash equivalents and short-term investments.. 440,455 301,614
General corporate assets ................................................. 331,014 378,893
Consolidated assets........................................................... $ 9,549,943 $ 8,608,944
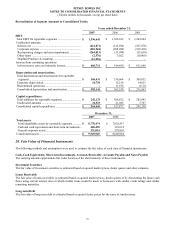
20. Fair Value of Financial Instruments
The following methods and assumptions were used to estimate the fair value of each class of financial instruments:
Cash, Cash Equivalents, Short-term Investments, Accounts Receivable, Accounts Payable and Notes Payable
The carrying amounts approximate fair value because of the short maturity of these instruments.
Investment Securities
The fair value of investment securities is estimated based on quoted market prices, dealer quotes and other estimates.
Loans Receivable
The fair value of loans receivable is estimated based on quoted market prices, dealer quotes or by discounting the future cash
flows using current interest rates at which similar loans would be made to borrowers with similar credit ratings and similar
remaining maturities.
Long-term Debt
The fair value of long-term debt is estimated based on quoted dealer prices for the same or similar issues.