Pitney Bowes 2007 Annual Report Download - page 98
Download and view the complete annual report
Please find page 98 of the 2007 Pitney Bowes annual report below. You can navigate through the pages in the report by either clicking on the pages listed below, or by using the keyword search tool below to find specific information within the annual report.-
 1
1 -
2
-
3
-
4
-
5
-
6
-
7
-
8
-
9
-
10
-
11
-
12
-
13
-
14
-
15
-
16
-
17
-
18
-
19
-
20
-
21
-
22
-
23
-
24
-
25
-
26
-
27
-
28
-
29
-
30
-
31
-
32
-
33
-
34
-
35
-
36
-
37
-
38
-
39
-
40
-
41
-
42
-
43
-
44
-
45
-
46
-
47
-
48
-
49
-
50
-
51
-
52
-
53
-
54
-
55
-
56
-
57
-
58
-
59
-
60
-
61
-
62
-
63
-
64
-
65
-
66
-
67
-
68
-
69
-
70
-
71
-
72
-
73
-
74
-
75
-
76
-
77
-
78
-
79
-
80
-
81
-
82
-
83
-
84
-
85
-
86
-
87
-
 88
88 -
 89
89 -
 90
90 -
 91
91 -
 92
92 -
 93
93 -
 94
94 -
 95
95 -
 96
96 -
 97
97 -
 98
98 -
 99
99 -
 100
100 -
 101
101 -
 102
102 -
 103
103 -
 104
104 -
 105
105 -
 106
106 -
 107
107 -
 108
108 -
109
-
110
 |
 |

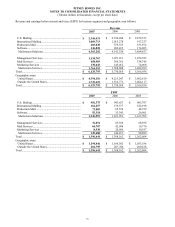
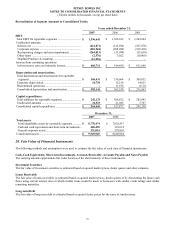
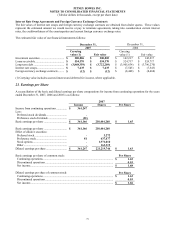
PITNEY BOWES INC.
NOTES TO CONSOLIDATED FINANCIAL STATEMENTS
(Tabular dollars in thousands, except per share data)
80
2006
Income Shares Per Share
Income from continuing operations ................ $ 565,659
Less:
Preferred stock dividends..............................
(1)
Preference stock dividends ........................... (86)
Basic earnings per share ................................. $ 565,572 222,473,514 $ 2.54
Basic earnings per share ................................. $ 565,572 222,473,514
Effect of dilutive securities:
Preferred stock .............................................. 1 6,815
Preference stock............................................ 86 682,934
Stock options ................................................ - 2,093,517
Other ............................................................. - 186,280
Diluted earnings per share .............................. $ 565,659 225,443,060 $ 2.51
Basic earnings per share of common stock: Per Share
Continuing operations.................................................................................................. $ 2.54
Discontinued operations .............................................................................................. (2.07)
Net income................................................................................................................... $ 0.47
Diluted earnings per share of common stock: Per Share
Continuing operations.................................................................................................. $ 2.51
Discontinued operations .............................................................................................. (2.04)
Net income................................................................................................................... $ 0.47
2005
Income Shares Per Share
Income from continuing operations ................ $ 473,243
Less:
Preferred stock dividends..............................
(1)
Preference stock dividends ........................... (93)
Basic earnings per share ................................. $ 473,149 228,833,070 $ 2.07
Basic earnings per share ................................. $ 473,149 228,833,070
Effect of dilutive securities:
Preferred stock .............................................. 1 8,307
Preference stock............................................ 93 732,276
Stock options ................................................ - 2,381,656
Other ............................................................. - 133,869
Diluted earnings per share .............................. $ 473,243 232,089,178 $ 2.04
Basic earnings per share of common stock: Per Share
Continuing operations.................................................................................................. $ 2.07
Discontinued operations .............................................................................................. 0.15
Net income................................................................................................................... $ 2.22
Diluted earnings per share of common stock: Per Share
Continuing operations.................................................................................................. $ 2.04
Discontinued operations .............................................................................................. 0.15
Net income................................................................................................................... $ 2.19
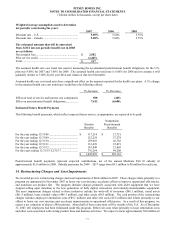
In accordance with SFAS No. 128, Earnings per Share, 0.5 million, 0.8 million and 1.5 million common stock equivalent
shares in 2007, 2006 and 2005, respectively, issuable upon the exercise of stock options were excluded from the above
computations because the exercise prices of such options were greater than the average market price of the common stock,
and therefore the impact of these shares was anti-dilutive.