Pitney Bowes 2007 Annual Report Download - page 27
Download and view the complete annual report
Please find page 27 of the 2007 Pitney Bowes annual report below. You can navigate through the pages in the report by either clicking on the pages listed below, or by using the keyword search tool below to find specific information within the annual report.-
 1
1 -
2
-
3
-
4
-
5
-
6
-
7
-
8
-
9
-
10
-
11
-
12
-
13
-
14
-
15
-
16
-
 17
17 -
 18
18 -
 19
19 -
 20
20 -
 21
21 -
 22
22 -
 23
23 -
 24
24 -
 25
25 -
 26
26 -
 27
27 -
 28
28 -
 29
29 -
 30
30 -
 31
31 -
 32
32 -
 33
33 -
 34
34 -
 35
35 -
 36
36 -
 37
37 -
38
-
39
-
40
-
41
-
42
-
43
-
44
-
45
-
46
-
47
-
48
-
49
-
50
-
51
-
52
-
53
-
54
-
55
-
56
-
57
-
58
-
59
-
60
-
61
-
62
-
63
-
64
-
65
-
66
-
67
-
68
-
69
-
70
-
71
-
72
-
73
-
74
-
75
-
76
-
77
-
78
-
79
-
80
-
81
-
82
-
83
-
84
-
85
-
86
-
87
-
88
-
89
-
90
-
91
-
92
-
93
-
94
-
95
-
96
-
97
-
98
-
99
-
100
-
101
-
102
-
103
-
104
-
105
-
106
-
107
-
108
-
109
-
110
 |
 |

9
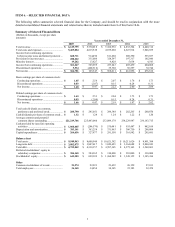
ITEM 6. – SELECTED FINANCIAL DATA
The following tables summarize selected financial data for the Company, and should be read in conjunction with the more
detailed consolidated financial statements and related notes thereto included under Item 8 of this Form 10-K.
Summary of Selected Financial Data
(Dollars in thousands, except per share
amounts)
Years ended December 31,
2007 2006 2005 2004 2003
Total revenue................................................. $ 6,129,795 $ 5,730,018 $ 5,366,936 $ 4,832,304 $ 4,440,312
Total costs and expenses................................ 5,469,084 4,815,528 4,555,268 4,223,914 3,846,655
Income from continuing operations
before income taxes and minority interest ...
660,711
914,490
811,668
608,390
593,657
Provision for income taxes ............................ 280,222 335,004 328,597 197,317 185,046
Minority interest ............................................ 19,242 13,827 9,828 5,634 4,543
Income from continuing operations ............... 361,247 565,659 473,243 405,439 404,068
Discontinued operations ................................ 5,534
(460,312) 35,368 56,557 72,744
Net income..................................................... $ 366,781 $ 105,347 $ 508,611 $ 461,996 $ 476,812
Basic earnings per share of common stock:
Continuing operations.................................. $ 1.65 $ 2.54 $ 2.07 $ 1.76 $ 1.73
Discontinued operations .............................. 0.03
(2.07) 0.15 0.24 0.31
Net income................................................... $ 1.68 $ 0.47 $ 2.22 $ 2.00 $ 2.04
Diluted earnings per share of common stock:
Continuing operations.................................. $ 1.63 $ 2.51 $ 2.04 $ 1.73 $ 1.71
Discontinued operations .............................. 0.03
(2.04) 0.15 0.24 0.31
Net income................................................... $ 1.66 $ 0.47 $ 2.19 $ 1.97 $ 2.02
Total cash dividends on common,
preference and preferred stock....................
$ 288,790
$ 285,051
$ 284,348
$ 282,265
$ 280,870
Cash dividends per share of common stock... $ 1.32 $ 1.28 $ 1.24 $ 1.22 $ 1.20
Average common and potential
common shares outstanding........................
221,219,746
225,443,060
232,089,178
234,229,987
236,183,715
Cash provided by (used in) operating
activities ..................................................... $ 1,060,465
$ (286,574) $ 530,441 $ 935,487 $ 842,109
Depreciation and amortization....................... $ 383,141 $ 363,258 $ 331,963 $ 306,750 $ 288,808
Capital expenditures ...................................... $ 264,656
$ 327,877 $ 291,550 $ 316,982 $ 285,681
Balance sheet
Total assets .................................................... $ 9,549,943 $ 8,608,944 $ 10,621,382 $ 10,211,626 $ 8,891,388
Long-term debt .............................................. $ 3,802,075 $ 3,847,617 $ 3,849,623 $ 3,164,688 $ 2,840,943
Total debt....................................................... $ 4,755,842 $ 4,338,157 $ 4,707,365 $ 4,375,163 $ 3,569,601
Preferred stockholders’ equity in
subsidiary companies..................................
$ 384,165
$ 384,165
$ 310,000
$ 310,000
$ 310,000
Stockholders’ equity ...................................... $ 643,303 $ 699,189 $ 1,364,249 $ 1,349,152 $ 1,145,416
Other
Common stockholders of record.................... 21,574 22,923 23,639 26,129 27,011
Total employees............................................. 36,165 34,454 34,165 35,183 32,474